Required section · Section 2 of 6
What a distribution plot measures
A measurement channel is a defined analytical path. In this XN-series workflow, the impedance RBC/platelet path sizes particles by electrical impedance. WDF (white-cell differential) uses forward-scattered light (FSC), side-scattered light (SSC), and side-fluorescent light (SFL) after channel-specific preparation; its displayed scattergram plots SSC against SFL. WNR (white-cell/nucleated-red-cell) is a separate fluorescence-flow channel used to distinguish WBCs from NRBCs. FSC, SSC, and SFL are signal names, not diagnoses. VCS (volume, conductivity, scatter) is a different, Beckman Coulter method family and is not a signal set or channel in this XN workflow.
For an impedance histogram, the mode is the volume with the greatest event density. RDW-CV is the coefficient of variation of the RBC volume distribution, expressed as a percentage; it depends on distribution width relative to MCV. RDW-SD is the direct histogram width in fL at the analyzer-defined height. Curve fitting is a mathematical approximation of a distribution, not a replacement for the observed event pattern or smear. These index definitions describe distributions; they do not assign a cause.
A scattergram maps simultaneous channel measurements into event clusters. Cluster position, dispersion, overlap, or events outside expected regions can trigger a review decision. Plot quality must also be assessed: sparse events, truncated axes, debris/background, or an obstructed flow cell can mimic or obscure a population, so follow the local repeat/quality procedure before interpretation. Name the channel and measured pattern first, then obtain the evidence required by the local rule.
Illustrative drawing — this picture was drawn rather than captured.
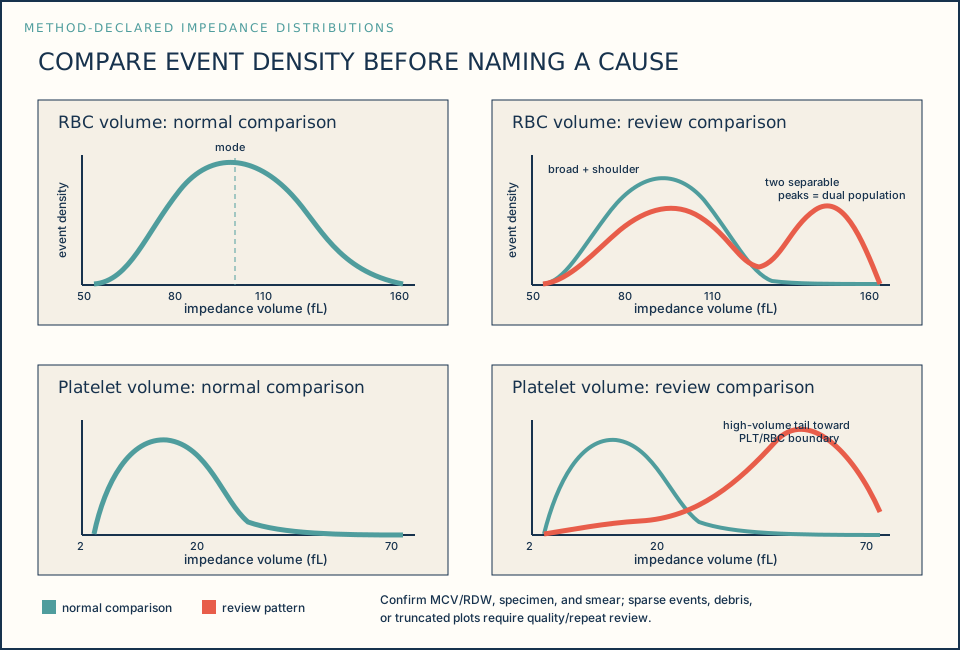
| Pattern feature | Normal comparison | Review pattern |
|---|---|---|
| Mode (RBC volume) | Single peak at the usual event-density maximum | May be shifted from the normal-comparison mode |
| Broadening / shoulder | Narrow, symmetric curve | Widened curve with an asymmetric shoulder |
| Dual population | Not present | Two separable event-density peaks |
| Platelet high-volume tail | Curve returns to baseline before the platelet/RBC boundary | Tail extends toward the platelet/RBC boundary |
Method-declared evidence sequence: use a validated local rule to make a release, review, repeat, or escalation decision.
Declare method
Identify analyzer, channel or plot, and software version before interpretation.
Read signal pattern
For the named channel, identify a distribution width, shoulder, tail, cluster dispersion, overlap, or unclassified events.
Correlate result
Compare CBC relationships, analyzer status, and tube appearance; do not treat a visual plot pattern as a diagnosis.
Choose bounded action
Choose the locally validated outcome: release, smear review, repeat/alternate measurement, recollection, or escalation.
Knowledge checks
Reading and checks are open. Sign in only to save.
Knowledge check 1
Knowledge check 2
Section status
Finish this section
Reading and checks are open. Sign in only to save.
The module finishes after every required section is marked done and every check in those sections is correct.