Required section · Section 3 of 6
What Moves the Number Besides Glucose
A1c is reported in the US as a percent on the NGSP (National Glycohemoglobin Standardization Program) scale. NGSP was created by the AACC Standards Committee in 1993 to standardize A1c methods to the DCCT reference, and it certifies both manufacturer methods and laboratories against that reference. In 2001 the IFCC (International Federation of Clinical Chemistry) approved a higher-order reference method that measures the glycated N-terminal beta-chain peptide and reports in mmol/mol; a master equation links the two scales, NGSP (%) equals 0.09148 times IFCC (mmol/mol) plus 2.152. Standardization is what lets a numeric A1c be compared meaningfully to outcome-linked thresholds. An unstandardized or uncertified method breaks that comparison, so the certification status belongs on every method-information record, not just the number.
eAG is a calculated convenience, not a second measurement. It comes from a population regression built on the ADAG study correlation between A1c and mean measured glucose (r = 0.92), and it carries a wide reported interval around each A1c value. An A1c of 7%, for example, maps to an eAG near 154 mg/dL but with a reported range near 123 to 185 mg/dL. eAG will not necessarily match a specific patient's own meter or CGM average, and it should never be read as a precise prediction.
Hemoglobin variant interference is method-specific. HbS, HbC, HbE, HbD, elevated HbF, and carbamylated hemoglobin can each cause a falsely high result, a falsely low result, or no clinically significant effect, and the direction depends on the exact analytical method, not the variant alone. The current NGSP interference table evaluates these variants against individual commercial methods, and it can differ by reagent lot. A hemoglobin trait does not automatically invalidate a given A1c method; confirm against the current listing before assuming a result is unusable.
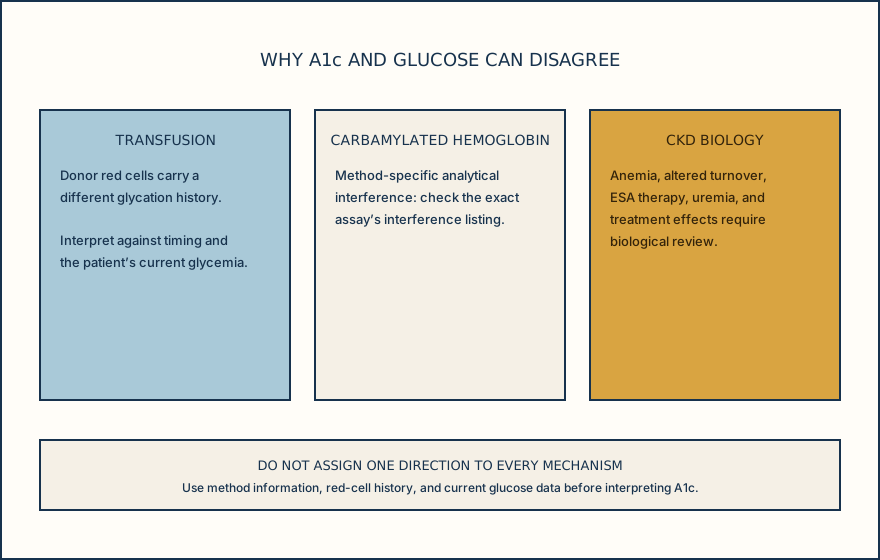
Three mechanisms must stay separate. Recent transfusion introduces donor red cells with a different glycation history. Carbamylated hemoglobin is a method-specific analytical interference that must be checked against the exact assay listing. CKD biology can include anemia, altered red-cell turnover, ESA therapy, uremia, and treatment effects; these may affect A1c biologically and do not belong on a falsely-high side of an interference diagram.
In advanced chronic kidney disease (CKD stages G4-G5), KDIGO's 2022 diabetes-and-CKD guidance states that A1c accuracy and precision decline, and A1c is particularly unreliable in people on dialysis; the distortion is commonly attributed to the same red-cell-survival factors above, plus iron/B12/folate deficiency and its treatment, and its direction and magnitude require review of the patient, treatment, and exact method. KDIGO recommends A1c review roughly twice yearly when control and therapy are stable, up to about four times yearly when a target is not met or therapy has changed, with individualized non-dialysis-CKD A1c targets generally ranging from below 6.5% to below 8.0%.
Fructosamine and glycated albumin are the standard fallback when A1c is judged unreliable, but they carry their own limits. Both are sensitive to abnormal albumin or protein turnover, hypoalbuminemia, nephrotic-range proteinuria, protein-losing states, advanced liver disease, and malnutrition, which limits their use in some of the same patients whose A1c is unreliable. They are also less standardized across assays and laboratories than A1c, with no single accepted A1c-equivalent conversion; trend a patient on the same assay over time rather than comparing across methods. Even a fully acceptable A1c has a blind spot of its own: it does not show glycemic variability, postprandial excursions, or hypoglycemic episodes, so a good A1c does not rule out clinically important hypoglycemia.
An A1c number is only as interpretable as the method behind it. Read the interference listing and the patient's red-cell-survival picture before you read the percentage.
Illustrative drawing — this picture was drawn rather than captured.
| NGSP A1c (%) | IFCC A1c (mmol/mol) | Calculated eAG (mg/dL) |
|---|---|---|
| 5.0 | 31 | 97 |
| 6.0 | 42 | 126 |
| 6.4 | 46 | 137 |
| 7.0 | 53 | 154 |
| 8.0 | 64 | 183 |
| 9.0 | 75 | 212 |
| Test | Approximate time window | Key limitation |
|---|---|---|
| Fructosamine | 2 to 4 weeks | Affected by abnormal protein turnover; no standardized A1c-equivalent conversion |
| Glycated albumin | 2 to 4 weeks | Same protein-turnover limitations as fructosamine; assay standardization varies by laboratory |
| CGM summary (GMI, TIR, mean glucose) | Commonly 14 to 90 days of stored data | Not used alone for a release or treatment decision |
General workflow for investigating an A1c-glucose discordance.
Check the interference listing
Compare the patient's known or suspected hemoglobin variant against the exact analyzer's current NGSP interference listing, not a general assumption about A1c methods.
Review red-cell survival factors
Look for anemia, CKD, ESA therapy, recent transfusion, blood loss, or hemodialysis, any of which can shift A1c independent of the assay chemistry.
Compare monitoring windows
Line up the A1c-derived eAG against the glucose log, CGM summary, or central-laboratory glucose on the same timeline before deciding anything looks wrong.
Select the next informative check
Choose fructosamine, glycated albumin, or a CGM/structured self-monitored-glucose review as the next step, rather than repeating the same A1c on the same sample.
Draft a bounded interpretive note
State what was measured, what is discordant, and the most likely explanation, without recommending a specific treatment change.
Knowledge checks
Reading and checks are open. Sign in only to save.
Knowledge check 1
Knowledge check 2
Knowledge check 3
Knowledge check 4
Section status
Finish this section
Reading and checks are open. Sign in only to save.
The module finishes after every required section is marked done and every check in those sections is correct.