Required section · Section 4 of 6
Working the numbers: a candidate glucose reagent lot
A hospital core laboratory is bringing a new lot of glucose reagent into service on its primary chemistry analyzer, a generic quantitative enzymatic method; no specific analyzer model or package insert is cited here. Stage 1 design, already established locally, sets three target concentration intervals bracketing the American Diabetes Association's fasting decision points: roughly 70-99 mg/dL (normal), 100-125 mg/dL (impaired fasting glucose, the prediabetes range), and 126-300 mg/dL (diabetes-range, confirmed on a separate day). Six fresh, unmodified leftover patient plasma specimens are tested on both the current and candidate lot within two hours of each other, one replicate per lot given adequate assay precision at this concentration range.
QC on both lots that same day is acceptable: the low control reads 68 mg/dL on the current lot and 70 mg/dL on the candidate lot against a target of 65 plus or minus 4 mg/dL, and the high control reads 296 mg/dL on the current lot and 299 mg/dL on the candidate lot against a target of 300 plus or minus 12 mg/dL. Both lots pass QC. As the mental-model section established, that does not settle the patient-sample question.
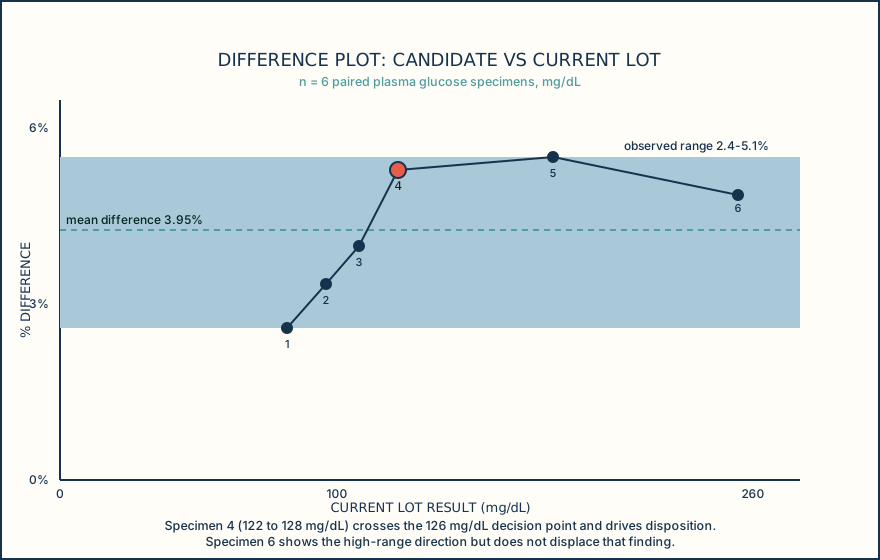
The paired patient results tell a different story. Every one of the six specimens reads higher on the candidate lot than the current lot, a positive bias ranging from 2 to 11 mg/dL, staying in a fairly consistent 2.4 to 5.1 percent relative range even as the absolute difference grows with concentration. That consistency, small in percent terms, present in the same direction on every specimen, should be plotted rather than collapsed into one pooled average, because the question that matters is not just the average bias but whether any individual result moved across a decision point.
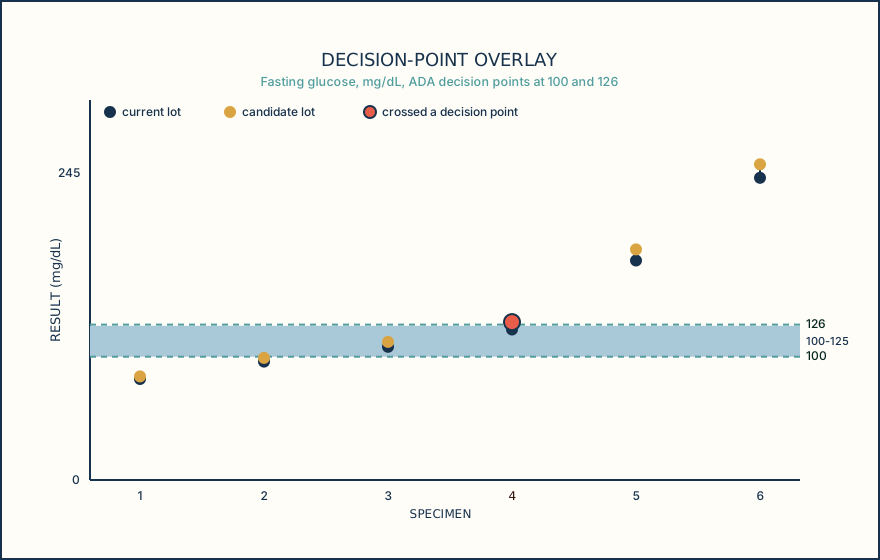
Checking each specimen against the 100 and 126 mg/dL decision points: specimens 1, 2, 3, 5, and 6 stay within the same concentration interval on both lots. Specimen 4 does not. Its current-lot result is 122 mg/dL, inside the 100-125 mg/dL prediabetes interval; its candidate-lot result is 128 mg/dL, at or above the 126 mg/dL threshold that the current 2024 ADA Standards of Care use to define the diabetes-range. A six mg/dL, 4.9 percent difference is well within the size of bias this lot shows elsewhere, but on this one specimen it is large enough, combined with where the patient's true value sits, to move the categorical read from prediabetes range to diabetes-range confirmation-pending. That is the concrete version of the general point: a statistically detectable lot difference is not automatically clinically important, and the deciding question is whether it could change interpretation for a specific specimen, not whether the pooled bias looks small.
Before treating this as a confirmed lot problem, the standard investigation applies: was the candidate lot calibrated with a verified calibrator lot and did the calibration curve look acceptable, are reagent storage and shipping records clean for both lots, and is there any instrument maintenance history that could explain the shift. A structured investigation separates those possibilities, plus sample degradation and the possibility that the current (outgoing) lot, not the candidate lot, is the one drifting, before treating the bias as a true reagent composition difference.
Pooling six specimens into one average bias would have hidden the one result that actually crossed a decision point; the specimen-by-specimen check against the decision points, not the average, is what drives the disposition.
Illustrative drawing — this picture was drawn rather than captured.
Illustrative drawing — this picture was drawn rather than captured.
| Specimen | Current lot (mg/dL) | Candidate lot (mg/dL) | Difference | % Difference |
|---|---|---|---|---|
| 1 | 82 | 84 | +2 | +2.4% |
| 2 | 96 | 99 | +3 | +3.1% |
| 3 | 108 | 112 | +4 | +3.7% |
| 4 | 122 | 128 | +6 | +4.9% |
| 5 | 178 | 187 | +9 | +5.1% |
| 6 | 245 | 256 | +11 | +4.5% |
Knowledge checks
Reading and checks are open. Sign in only to save.
Knowledge check 1
Knowledge check 2
Section status
Finish this section
Reading and checks are open. Sign in only to save.
The module finishes after every required section is marked done and every check in those sections is correct.