Required section · Section 3 of 6
Tools: Demand, Waste Controls, and Metrics
A shared vocabulary makes flow visible. Takt time is the pace demand sets, roughly how often one result needs to be finished to keep up with arrivals. Demand and capacity are compared over the same window; cycle time is the time one unit takes at one step; lead time is the time from arrival to finished result, receipt-to-release for the stat BMP case. Queue time is time spent waiting for a step to start, not being worked. Batching groups units before advancing them together; utilization is how much of a resource's available time is used; a bottleneck is the step where demand exceeds capacity and a queue forms upstream of it.
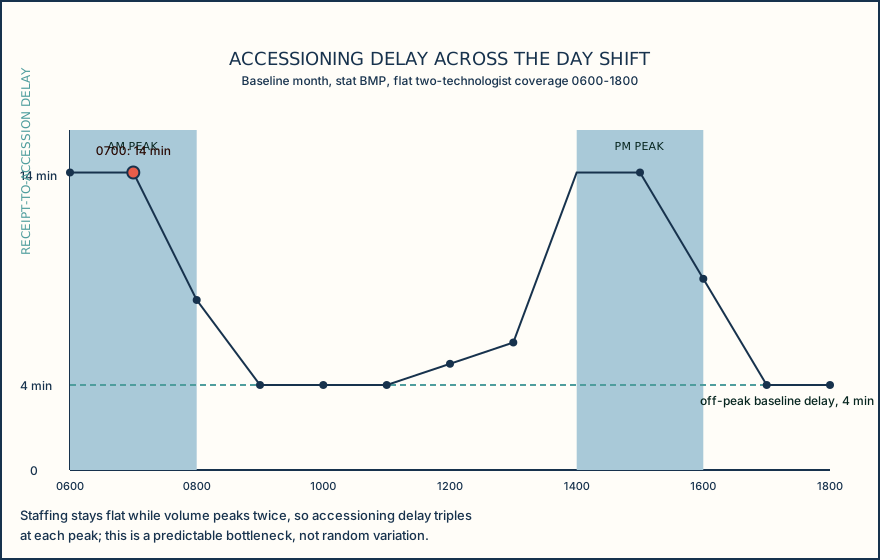
In the baseline case, the accessioning step is that bottleneck. Specimen arrival is not uniform across a shift; predictable peaks occur around morning collection rounds and after clinic hours, here 0600 to 0800 and 1400 to 1600. Staffing stays flat at two technologists across the full 12-hour day shift, unchanged through both peaks. Accessioning delay during peaks runs a median of 14 minutes versus 4 minutes off-peak, and that preanalytic delay is not always visible in a computer-generated turnaround-time report built from order and result timestamps alone, so it can hide inside an acceptable-looking summary number.
5S (sort, set in order, shine, standardize, sustain) is a visual-management method that makes normal and abnormal workplace conditions self-evident, so a missing reagent or a misplaced tube rack is obvious at a glance rather than discovered mid-run. A published hospital laboratory application of 5S reported improved employee performance, fewer repeats, and turnaround time improved by more than 25 percent after sorting, standardizing, and clarifying documentation. Standard work, a written, agreed current-best method for a task, gives 5S and any later change something stable to compare against.
Poka-yoke, mistake-proofing, is a mechanism that either prevents an error from happening or makes an error immediately obvious when it does. It can be preventive, stopping the error, or detective, catching it right away. A concrete laboratory example: batching multiple labeled slides or specimen blocks from different patients together at one processing station raises the risk of a specimen switch, because the physical separation between patients' work is lost during the batch.
Single-piece flow moves one unit at a time through each step instead of accumulating a batch before advancing. It removes the wait for a batch to fill, but it forgoes the equipment-utilization and per-test-cost efficiency batching provides; the tradeoff literature frames larger batches as reducing effective takt time while increasing misidentification risk. Neither is universally correct; the choice depends on the instrument, the specimen type, and the risk of the specific workstation, and it is a local decision. Any change to a method or workflow, including how testing is batched, that constitutes a system modification still requires the laboratory to establish or re-verify performance specifications under CLIA before results are reported from it; Lean and Six Sigma project language does not substitute for that requirement or for the laboratory's change-control process.
Sigma metrics quantify defect rate as defects per million opportunities (DPMO), but DPMO requires an explicit, laboratory-defined defect and opportunity before it means anything, for example one result outside allowable total error, one mislabeled specimen, or one report released outside the required turnaround time; there is no single universal opportunity definition across laboratories. Under the standard 1.5-sigma-shift convention used in laboratory quality literature, roughly 3 sigma corresponds to about 66,800 to 67,000 DPMO, 4 sigma to about 6,200, 5 sigma to about 230 to 233, and 6 sigma to about 3.4. A separate, analytical-capability Sigma can be calculated as Sigma equals allowable total error minus the absolute value of bias, divided by imprecision (coefficient of variation); this is a distinct calculation from an outcome-based DPMO count, and a QC plan should still be built from the measuring system, environment, clinical application, regulation, and patient risk, not from a Sigma value alone.
Illustrative drawing — this picture was drawn rather than captured.
| Waste | Laboratory example |
|---|---|
| Defects/rework | A hemolyzed or short-filled stat BMP tube requires recollection. |
| Overproduction | Manually prepared reagent made ahead of demand is discarded unused. |
| Waiting | An accessioned specimen sits idle during a peak-volume backlog. |
| Non-utilized talent | A certified technologist performs manual data entry a system could automate. |
| Transportation | A specimen is physically carried between a satellite draw site and the core lab. |
| Inventory | Excess reagent or supplies sit on the shelf past their useful turnover point. |
| Motion | Staff walk repeatedly between a workstation and a supply room during a run. |
| Extra processing | A result is checked or re-entered more times than the workflow requires. |
| Sigma level | Approximate DPMO |
|---|---|
| 3 sigma | about 66,800-67,000 |
| 4 sigma | about 6,200 |
| 5 sigma | about 230-233 |
| 6 sigma | about 3.4 |
Ordering exercise
Put the five 5S steps in the order a laboratory bench applies them, from first to last.
1. Standardize
Write the agreed layout and cleaning routine down as the shared standard.
2. Sort
Remove items not needed at the workstation for the task at hand.
3. Sustain
Audit against the standard on a schedule so the gain does not erode.
4. Shine
Clean the workstation and inspect equipment while cleaning it.
5. Set in order
Arrange what remains so each item has one visible, marked place.
Knowledge checks
Reading and checks are open. Sign in only to save.
Knowledge check 1
Knowledge check 2
Section status
Finish this section
Reading and checks are open. Sign in only to save.
The module finishes after every required section is marked done and every check in those sections is correct.