Required section · Section 4 of 6
Working the Baseline Numbers
Lay the case out step by step. Stat BMP volume for the baseline month is 850. Mean TAT is 42 minutes, median is 38 minutes, and the 90th percentile is 71 minutes; 145 of 850 results, 17.1 percent, exceed the 45-minute target. Turnaround-time reporting literature recommends tracking the median and 90th percentile alongside the mean, not the mean alone, because TAT distributions are positively skewed: more events prolong a result than shorten one. That is exactly the pattern here.
The next question is where the delay concentrates, and the local baseline answers it: specimens queue at accessioning, not at the analytic run. Preanalytic (receipt-to-accession) delay runs a median of 14 minutes during the two daily arrival peaks, 0600 to 0800 and 1400 to 1600, versus 4 minutes off-peak, while staffing stays flat at two technologists across the full shift. The analytic and postanalytic steps are not where this month's problem lives; the bottleneck is a fixed resource meeting a variable demand pattern.
Recollection adds a separate, smaller signal: 2.3 percent of stat BMPs are recollected for hemolysis or a short-filled tube. That rate matters as a balancing measure later, because a fix aimed at speed that rushes specimen draws could raise it even while turnaround time improves.
Published projects may suggest questions to investigate, but they do not set this laboratory’s target or prove this countermeasure will transfer; the decision stays with the local baseline, the peak-accession constraint, and the balancing limits established before the pilot.
Chase the number that is failing, not the number that is easiest to report; here that means designing around the 90th-percentile peak delay, not the passing mean.
Illustrative drawing — this picture was drawn rather than captured.
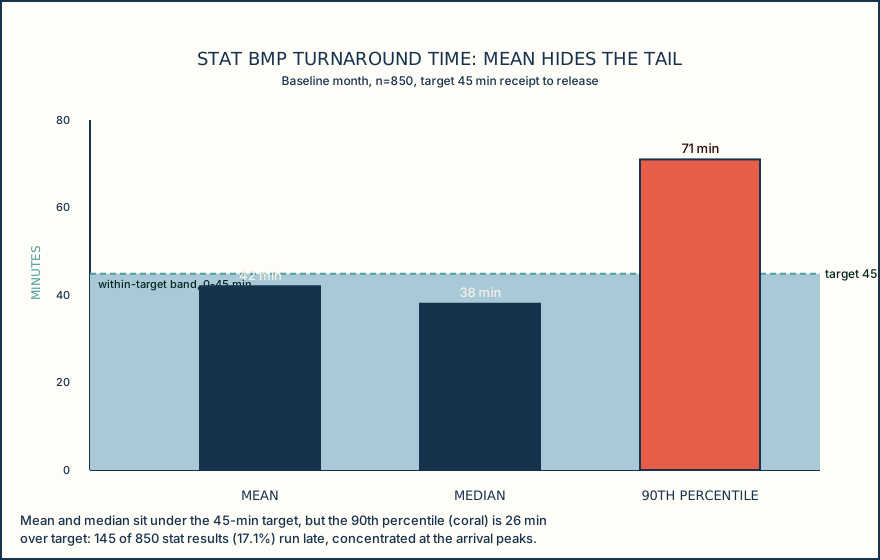
| Metric | Value | Versus 45-minute target |
|---|---|---|
| Mean TAT | 42 minutes | 3 minutes under target |
| Median TAT | 38 minutes | 7 minutes under target |
| 90th-percentile TAT | 71 minutes | 26 minutes over target |
| Results exceeding target | 145 of 850 (17.1%) | not applicable |
Knowledge checks
Reading and checks are open. Sign in only to save.
Knowledge check 1
Knowledge check 2
Section status
Finish this section
Reading and checks are open. Sign in only to save.
The module finishes after every required section is marked done and every check in those sections is correct.