Required section · Section 4 of 6
Ten replicates, one run
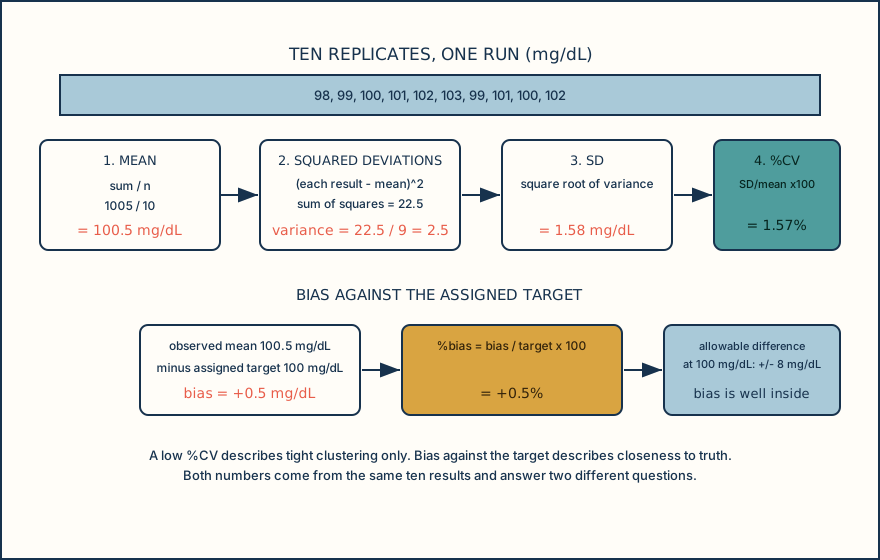
A bench tech runs the glucose Level 2 control ten times in one run: 98, 99, 100, 101, 102, 103, 99, 101, 100, 102 mg/dL, against an assigned target of 100 mg/dL. Ten replicates in one run do not satisfy the structured multi-day replicate design a laboratory uses to formally verify precision and bias.
The mean is the sum of the ten results divided by ten: 1005 divided by 10 equals 100.5 mg/dL. Each result's deviation from the mean is squared and summed, giving a sum of squared deviations of 22.5. This replicate set is a sample used to estimate a larger variance, and estimating the sample mean uses one degree of freedom; therefore dividing by n − 1, or nine, gives a variance of 2.5. The square root of the variance gives a standard deviation of 1.58 mg/dL.
The coefficient of variation restates that spread as a percentage of the mean: 1.58 divided by 100.5, times 100, equals 1.57%. A %CV this low, for this analyte and this concentration, describes tight clustering; it says nothing on its own about whether the results are close to the target.
Bias answers that second question: the observed mean of 100.5 mg/dL minus the assigned target of 100 mg/dL equals plus 0.5 mg/dL, or plus 0.5%. Comparing that bias against the allowable difference established earlier for this concentration (plus or minus 8 mg/dL) shows the bias is well inside the allowable range. This run supports two separate, defensible conclusions: the method is precise at this concentration in this run, and it shows a small, non-actionable positive bias against the assigned target. It does not, by itself, establish the method's within-laboratory precision or reproducibility, and it does not establish a measurement uncertainty estimate.
Report %CV and bias as two separate numbers from the same data set, and do not let a passing bias hide a failing %CV or the reverse.
Illustrative drawing — this picture was drawn rather than captured.
| Replicate | Result (mg/dL) |
|---|---|
| 1 | 98 |
| 2 | 99 |
| 3 | 100 |
| 4 | 101 |
| 5 | 102 |
| 6 | 103 |
| 7 | 99 |
| 8 | 101 |
| 9 | 100 |
| 10 | 102 |
Knowledge checks
Reading and checks are open. Sign in only to save.
Knowledge check 1
Knowledge check 2
Section status
Finish this section
Reading and checks are open. Sign in only to save.
The module finishes after every required section is marked done and every check in those sections is correct.