Required section · Section 2 of 6
Two lanes: what the method does, what the test means
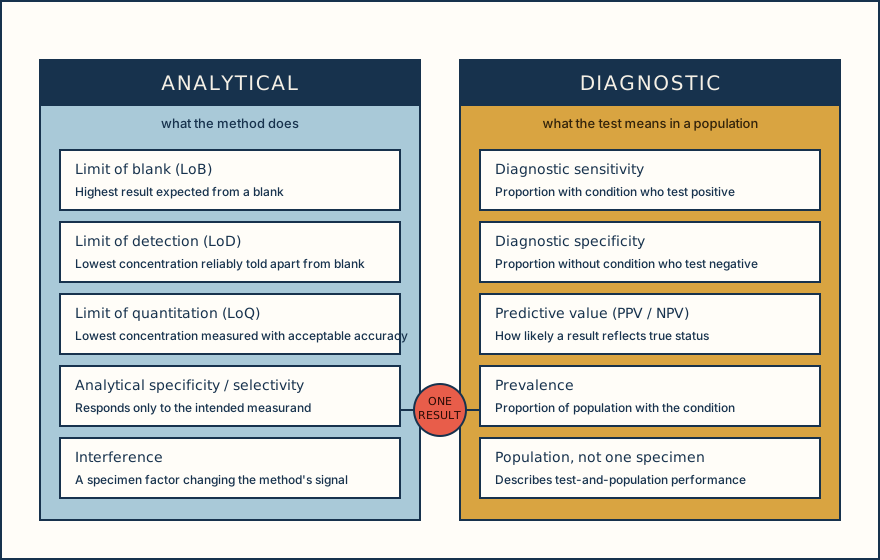
Laboratory performance language splits cleanly into two lanes, and mixing them is the single most common source of confusion at the bench. The analytical lane describes what a measurement procedure does when it responds to a specimen: how little analyte it can detect, whether it responds only to the intended measurand, and whether something else in the specimen changes its signal. The diagnostic lane describes how a test result behaves across a population of patients with and without a defined condition: how often it catches disease, how often it correctly clears people without it, and what a given result means in the population being tested.
In the analytical lane, three terms answer three different questions and are frequently confused with one another. Limit of blank (LoB) is the highest result a method is expected to produce from a sample that truly contains no analyte, at a stated probability. Limit of detection (LoD) is the lowest concentration a method can reliably tell apart from that blank. Limit of quantitation (LoQ) is the lowest concentration the method can measure with an accuracy and precision the laboratory has defined as acceptable. A result can sit above LoD and still be too imprecise to report as a number, because LoD only proves the analyte is there, not that the method can measure it well at that concentration. Current CLSI guidance discourages the older term "analytical sensitivity" for this idea altogether, because it has been used inconsistently, and prefers LoB, LoD, and LoQ as three separate, ordered questions.
Analytical specificity, sometimes called selectivity, is the ability of a measurement procedure to respond only to the intended measurand and not to other substances in the specimen. It is a property of the method, evaluated once during validation and reverified when the method changes, not a property that varies patient to patient. Cross-reactivity, where an antibody or probe reacts with a structurally related but unintended substance, is one specific mechanism that reduces analytical specificity. Hemolysis, icterus, and lipemia are different mechanisms from cross-reactivity. Hemolysis can release intracellular constituents, including potassium from red cells, as well as alter specimen background; icterus and lipemia can alter specimen background. A method can therefore lose accuracy on a hemolyzed specimen with no cross-reactivity involved at all.
The diagnostic lane starts from a 2x2 table: true positive, false positive, false negative, true negative, counted against a defined reference standard for the condition. Diagnostic sensitivity is the proportion of people with the condition who test positive. Diagnostic specificity is the proportion of people without the condition who test negative. Positive predictive value (PPV) and negative predictive value (NPV) answer the question a clinician actually wants answered: given this result, how likely is the condition present or absent? PPV and NPV depend heavily on prevalence, the proportion of the tested population who truly have the condition, even when sensitivity and specificity stay fixed.
A worked example makes the prevalence effect concrete. At 1% prevalence, a test with 90% sensitivity and 90% specificity applied to 10,000 people produces 90 true positives and 990 false positives: 1,080 positive results and a PPV of 90 / 1,080 = 8.33%. At 50% prevalence, the same test produces 4,500 true positives and 500 false positives: 5,000 positive results and a PPV of 4,500 / 5,000 = 90%. The test itself has not changed; the population has.
Name which lane a question belongs to before answering it. A discordant single result is usually an analytical-lane problem to investigate at the bench; a question about how much weight one result should carry for diagnosis is a diagnostic-lane problem about the test and the population, not about that one specimen.
Illustrative drawing — this picture was drawn rather than captured.
Deciding which lane a laboratory question belongs to before choosing an investigation.
Name the question
Decide whether the concern is about detection capability, about something in the specimen changing the signal, or about how much one result supports a diagnosis across a population.
Check detection capability
If the concern is a low or borderline result, compare it against the method's LoB, LoD, and LoQ rather than assuming any positive-looking signal is a reliable, quantifiable result.
Check for interference
If the concern is a specimen-related change in signal, review the specimen for hemolysis, icterus, lipemia, or a known cross-reactant, and check the exact method's current interference table.
Check diagnostic context
If the concern is how much the result supports a clinical conclusion, consider the test's diagnostic sensitivity and specificity together with the prevalence of the condition in the population being tested.
Knowledge checks
Reading and checks are open. Sign in only to save.
Knowledge check 1
Knowledge check 2
Section status
Finish this section
Reading and checks are open. Sign in only to save.
The module finishes after every required section is marked done and every check in those sections is correct.