Required section · Section 3 of 6
The variables that decide the answer
Fasting status matters for two of the five criteria. Fasting is defined as no caloric intake for at least 8 hours before the draw. The 2018 AHA/ACC cholesterol guideline actually permits a fasting or nonfasting lipid profile to estimate baseline risk in adults not on lipid-lowering therapy, but if a nonfasting triglyceride result comes back 400 mg/dL or higher, the guideline calls for a fasting repeat to assess triglycerides and baseline LDL-C accurately.
The same guideline classifies triglycerides 175-499 mg/dL as moderate hypertriglyceridemia and 500 mg/dL or higher fasting as severe, with 1,000 mg/dL fasting providing pancreatitis-risk context; whether and when the laboratory notifies a clinician follows its local notification policy. Metabolic syndrome, diabetes, chronic kidney or liver disease, hypothyroidism, and certain medications are listed secondary contributors to moderate hypertriglyceridemia that the guideline says should be addressed alongside the number.
Glucose specimen handling protects the fasting-glucose criterion and the diagnostic thresholds alike. Venous plasma is the preferred specimen for diagnostic glucose testing, collected in a gray-top sodium fluoride/potassium oxalate tube. Sodium fluoride inhibits glycolysis at the enolase step, a relatively late reaction, so glucose in an unspun fluoride tube can still drift downward in the first hours after the draw. Prompt centrifugation and separation, not the additive alone, is the preanalytical step that protects the result.
Diabetes itself is diagnosed on different, higher thresholds than the metabolic-syndrome glucose criterion: fasting plasma glucose 126 mg/dL or higher, A1c 6.5% or higher, a 2-hour oral glucose tolerance test (OGTT) value of 200 mg/dL or higher, or a random glucose of 200 mg/dL or higher with classic hyperglycemia symptoms. Absent unequivocal hyperglycemia, current ADA guidance requires two abnormal results, the same test repeated or two different tests, before a diabetes diagnosis is confirmed.
CGM adds a different measurement entirely: interstitial-fluid glucose from a subcutaneous electrochemical sensor, not a direct blood measurement. For the FDA-cleared Dexcom G7, adult mean absolute relative difference (MARD) against a laboratory reference ran from about 6.0% at glucose above 250 mg/dL to about 16.0% at glucose below 54 mg/dL, so accuracy is not even across the glucose range and is worst exactly where a low-glucose decision matters most.
The G7 requires a warm-up period, about 30 minutes per FDA review, during which the display shows no interpretable value or trend arrow. Pressure on the sensor, for example lying on it overnight, can produce a spurious low reading called a compression artifact that resolves once pressure is relieved and is not confirmed by a fingerstick meter.
FDA labeling for this device class instructs using a blood-glucose meter for treatment decisions whenever symptoms do not match the displayed value, the system does not show both a number and a trend arrow, or the sensor is still warming up. These figures are specific to one FDA-cleared device and should not be assumed for a different CGM system without checking that device's own labeling.
The international consensus on CGM reporting defines standard glucose bands: below 54, 54-69, 70-180, 181-250, and above 250 mg/dL. Targets for most nonpregnant adults with diabetes are time in range (TIR, 70-180) above 70%, time below 70 mg/dL under 4%, time below 54 mg/dL under 1%, time above 180 mg/dL under 25%, time above 250 mg/dL under 5%, and a coefficient of variation (CV) target of 36% or less as the standard variability metric.
A report should be assessed across the full 14-day window. The consensus recommendation of at least 14 days with at least 70% sensor active time is an aggregate recommendation, not a daily cutoff: it does not guarantee that every event or every day is interpretable. Review missingness and artifacts before interpreting a specific event.
Check fasting status, specimen handling, sensor data sufficiency, and device-specific labeling before treating any single glucose, lipid, or CGM number as ready for interpretation.
Illustrative drawing — this picture was drawn rather than captured.
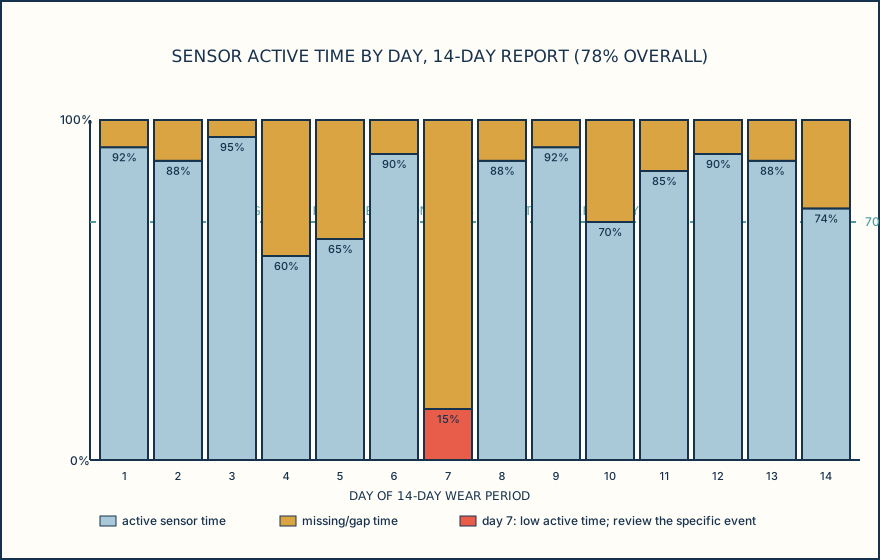
| Metric | This report | Consensus target | Meets target |
|---|---|---|---|
| Sensor active time | 78% | at least 70% over 14 days | yes |
| Mean glucose | 152 mg/dL | no fixed target | n/a |
| Time in range 70-180 mg/dL | 68% | above 70% | no, modestly below |
| Time above range >180 mg/dL | 27% | below 25% | no, modestly above |
| Time above range >250 mg/dL | 4% | below 5% | yes |
| Time below range <70 mg/dL | 2% | below 4% | yes |
| Coefficient of variation | 31% | 36% or less | yes |
Knowledge checks
Reading and checks are open. Sign in only to save.
Knowledge check 1
Section status
Finish this section
Reading and checks are open. Sign in only to save.
The module finishes after every required section is marked done and every check in those sections is correct.