Required section · Section 4 of 6
Working the case: two disagreements, two explanations
Return to the case. The population needed to select an applicable waist cutoff is not supplied, so waist is not scored. Four other independent criteria are met: triglycerides 187 mg/dL, HDL 38 mg/dL (male), blood pressure 134/86 mmHg, and fasting glucose 118 mg/dL under the 2009 harmonized definition. Those four criteria support the ≥3 classification without assigning a waist result.
Checked against the original 2001 ATP III glucose threshold of 110 mg/dL or higher, the same 118 mg/dL value still qualifies, so both versions support a metabolic-syndrome pattern here. That agreement is a property of this particular glucose value; a fasting glucose between 100 and 109 mg/dL would count under the 2009/2004 threshold but not under the original 2001 threshold, which is exactly why the version applied belongs in the written comment.
The lipid picture needs its own caveat. Triglycerides of 187 mg/dL fasting falls in the moderate hypertriglyceridemia range (175-499 mg/dL) under the 2018 AHA/ACC guideline, well short of the 500 mg/dL severe threshold and far short of the 1,000 mg/dL pancreatitis-risk flag. The guideline lists metabolic syndrome itself, along with diabetes, chronic kidney or liver disease, hypothyroidism, and certain medications, as secondary contributors to moderate hypertriglyceridemia worth addressing rather than treating the number in isolation.
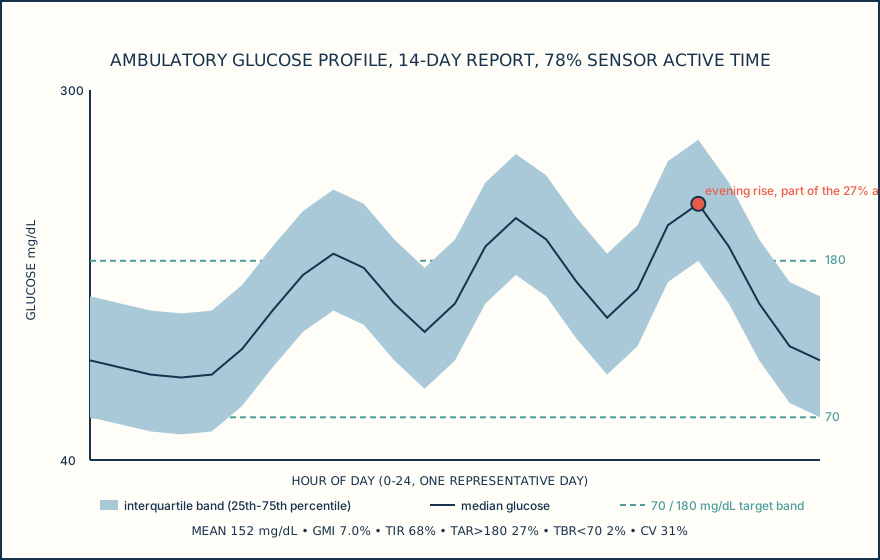
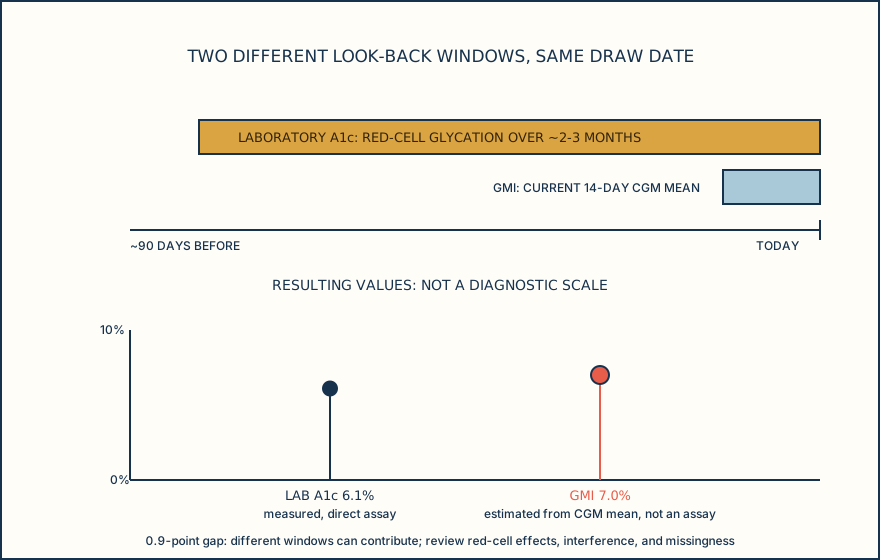
Now the CGM side. Mean glucose over the 14-day report is 152 mg/dL. GMI is calculated from that mean using a published regression, GMI% = 3.31 + 0.02392 x mean glucose in mg/dL: 3.31 + 0.02392 x 152 = 6.95%, displayed as 7.0%. That is a statistical estimate built from 14 days of interstitial glucose, not a laboratory assay. The laboratory A1c drawn the same visit is 6.1%, a direct assay result reflecting roughly the prior 2-3 months, weighted toward more recent weeks. The two numbers disagree by about 0.9 percentage points. In the source analysis behind the GMI formula, a laboratory A1c of 8.0% corresponded to CGM mean glucose values spanning roughly 155 to 218 mg/dL across different people, so a spread this size between GMI and laboratory A1c is expected, not a red flag for either method. Differences of this kind can reflect variation in red-blood-cell lifespan and glycation rate between individuals, glucose changes too recent to show up in A1c yet, or the specific duration and completeness of the CGM window behind the GMI, rather than a testing error in either result.
One more detail earns a second look: an isolated overnight low flagged on day 7, the same day sensor active time dropped to 15%, with no preceding downward trend and no confirming fingerstick. That pattern, a sudden isolated low with no lead-in and no confirmation, fits a compression artifact from pressure on the sensor rather than a true hypoglycemic event, and it lands on the one day this report's data quality was weakest.
Work each disagreement back to its source, criteria version for the metabolic-syndrome call, assay window for the A1c-versus-GMI gap, before writing any comment that implies one number is wrong.
Illustrative drawing — this picture was drawn rather than captured.
Illustrative drawing — this picture was drawn rather than captured.
| Criterion | Result | Threshold used | Meets criterion |
|---|---|---|---|
| Waist circumference | 106 cm | Population cutoff not supplied | Unscored |
| Triglycerides | 187 mg/dL, fasting | at or above 150 mg/dL | yes |
| HDL cholesterol | 38 mg/dL (male) | below 40 mg/dL | yes |
| Blood pressure | 134/86 mmHg, untreated | at or above 130/85 mmHg | yes |
| Fasting glucose | 118 mg/dL | at or above 100 mg/dL | yes |
Knowledge checks
Reading and checks are open. Sign in only to save.
Knowledge check 1
Knowledge check 2
Section status
Finish this section
Reading and checks are open. Sign in only to save.
The module finishes after every required section is marked done and every check in those sections is correct.