Required section · Section 4 of 6
Working the case
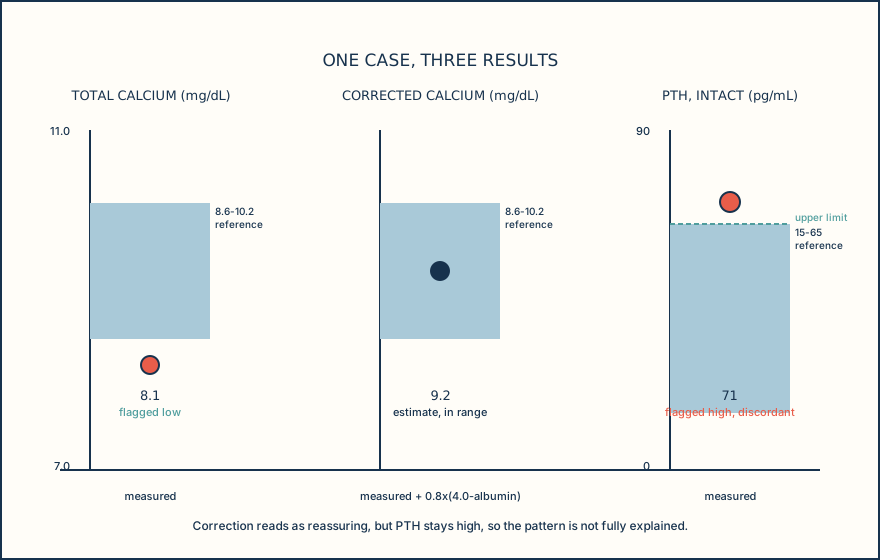
Return to the case: total calcium 8.1 mg/dL (reference 8.6-10.2 mg/dL, flagged low), albumin 2.6 g/dL (reference 3.5-5.0 g/dL, flagged low), phosphate 3.0 mg/dL (reference 2.5-4.5 mg/dL, within interval), magnesium 1.9 mg/dL (reference 1.7-2.3 mg/dL, within interval), intact PTH 71 pg/mL (illustrative reference about 15-65 pg/mL, flagged high), 25(OH)D 14 ng/mL (flagged low by the local report), and eGFR 78 mL/min/1.73m^2, not indicative of significant CKD. The corrected calcium, 8.1 + 0.8 x (4.0 - 2.6) = 9.2 mg/dL, lands inside the reference interval.
Read in isolation, the corrected calcium looks reassuring: math has moved a flagged-low number into range. But the correction formula is only an estimate of total calcium at a reference albumin level, and it performs poorly exactly in states like this one, hypoalbuminemia, where the formula is being leaned on hardest. It does not measure ionized calcium, and it says nothing about whether ionized calcium is actually normal.
The elevated PTH is the signal that does not fit a fully-explained low calcium. If the patient's true ionized calcium were normal, PTH would not be expected to run high, because rising calcium should suppress PTH secretion through the feedback loop covered earlier. Low albumin, low 25(OH)D, and elevated PTH together are more consistent with reduced intestinal calcium absorption from low vitamin D status driving a secondary rise in PTH, than with a low total calcium that the correction formula has already fully accounted for. eGFR of 78 argues against a CKD-driven secondary pattern here; phosphate and magnesium being within interval do not point toward hypoparathyroidism (which pairs low PTH with low calcium and high phosphate) or toward CKD-associated secondary hyperparathyroidism (which typically shows elevated phosphate).
None of this proves a diagnosis from one panel. It does establish that the case is not closed by the correction formula alone, and that the next useful step is a test that measures the active fraction directly rather than one that re-estimates it.
When a corrected calcium and a PTH disagree, trust the physiology of the feedback loop over the calculation of the correction formula.
Illustrative drawing — this picture was drawn rather than captured.
| Analyte | Result | Unit | Reference interval | Flag |
|---|---|---|---|---|
| Total calcium | 8.1 | mg/dL | 8.6-10.2 | Low |
| Albumin | 2.6 | g/dL | 3.5-5.0 | Low |
| Corrected calcium (estimate) | 9.2 | mg/dL | 8.6-10.2 | Within interval |
| Phosphate | 3.0 | mg/dL | 2.5-4.5 | Within interval |
| Magnesium | 1.9 | mg/dL | 1.7-2.3 | Within interval |
| PTH, intact | 71 | pg/mL | 15-65 (illustrative) | High |
| 25(OH)D | 14 | ng/mL | Local flag, not universal | Low |
| eGFR | 78 | mL/min/1.73m^2 | Lab-specific | Not indicative of CKD |
Knowledge checks
Reading and checks are open. Sign in only to save.
Knowledge check 1
Section status
Finish this section
Reading and checks are open. Sign in only to save.
The module finishes after every required section is marked done and every check in those sections is correct.