Required section · Section 4 of 6
Working the case: is 44 percent an expected response
Return to the opening case with the full data in view. Baseline, day 0, before the first statin dose: fasting specimen, total cholesterol 240 mg/dL, HDL-C 45 mg/dL, triglycerides 150 mg/dL, calculated LDL-C 165 mg/dL, non-HDL-C 195 mg/dL. Follow-up, week 6, on unchanged high-intensity statin dosing with medication history confirming consistent daily use: fasting specimen, total cholesterol 165 mg/dL, HDL-C 46 mg/dL, triglycerides 130 mg/dL, calculated LDL-C 93 mg/dL, non-HDL-C 119 mg/dL. Both draws used the same analyzer platform, the same continuous Friedewald calculation method, and the same reagent lot.
First, specimen and method continuity: neither specimen was hemolyzed or short filled, both were confirmed fasting, and the calculation method did not change between draws, so the two LDL-C values are directly comparable. Second, internal consistency: at follow-up, non-HDL-C (119) remains greater than LDL-C (93), which is the expected relationship, and non-HDL-C fell in proportion to LDL-C rather than diverging from it. Third, the triglyceride value stayed well under the 400 mg/dL Friedewald ceiling at both draws, so the calculated LDL-C is valid at both time points on that basis.
With specimen, method, and internal consistency all checked and clear, the percentage change is the number to evaluate: (165 minus 93) divided by 165 equals 44 percent. High-intensity statin therapy is expected to produce a reduction of roughly 50 percent or more from an untreated baseline. Forty-four percent falls below that expected range despite confirmed adherence, an unchanged dose, and an unchanged method. This case-specific percentage is below the stated expectation; it does not by itself establish an analytical problem, drug failure, or a laboratory flag or release action.
The reasoning stops there for the laboratory. Possible clinical explanations, partial adherence not captured in the medication history, an absorption issue, or genuine relative statin resistance, are for the clinician to sort out with the patient. What the laboratory contributes is the verified, comparable pair of numbers and the case-specific calculation comparison with the stated expectation.
A documented check of specimen integrity, method continuity, and internal consistency turns a below-expected-range percentage reduction into a case-specific observation instead of an unexplained outlier.
Illustrative drawing — this picture was drawn rather than captured.
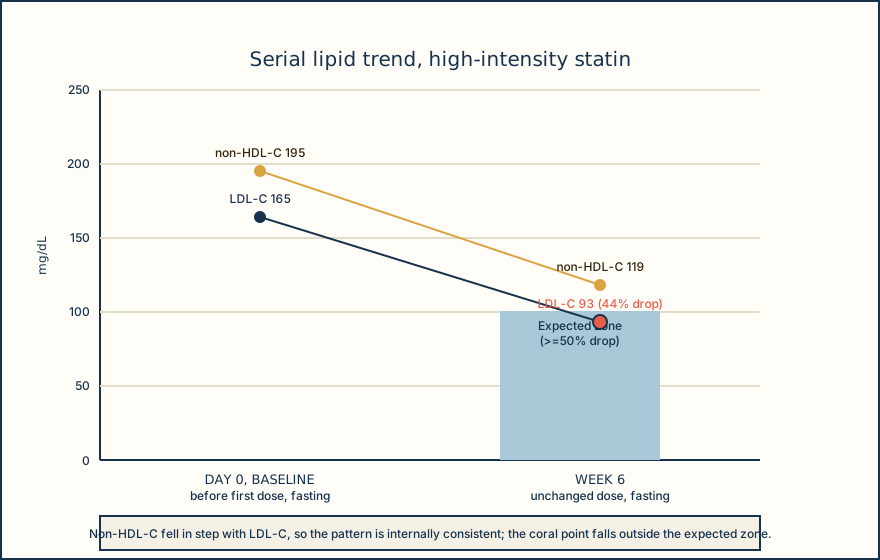
| Analyte | Baseline (day 0) | Week 6 (on statin) |
|---|---|---|
| Total cholesterol, mg/dL | 240 | 165 |
| HDL-C, mg/dL | 45 | 46 |
| Triglycerides, mg/dL | 150 | 130 |
| LDL-C, calculated (Friedewald), mg/dL | 165 | 93 |
| Non-HDL-C, mg/dL | 195 | 119 |
Knowledge checks
Reading and checks are open. Sign in only to save.
Knowledge check 1
Section status
Finish this section
Reading and checks are open. Sign in only to save.
The module finishes after every required section is marked done and every check in those sections is correct.