Required section · Section 4 of 6
Case 3, worked: falling platelets and a widening screen
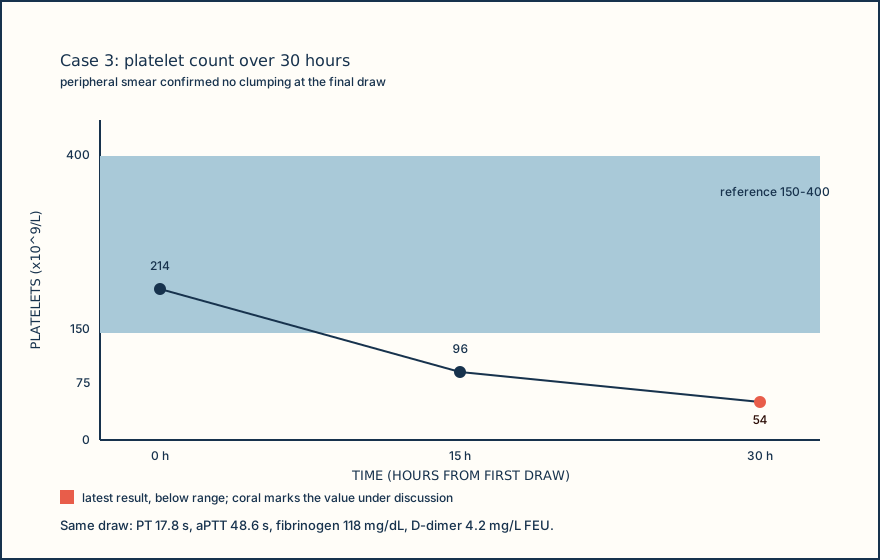
A patient in an acute inpatient setting has a platelet trend of 214 to 96 to 54 x10^9/L over 30 hours. The current citrate specimen is correctly filled, not clotted, and received promptly, so specimen quality is not the explanation this time. On the mechanical clot-detection analyzer: PT 17.8 s (interval 10.0-13.0), aPTT 48.6 s (interval 25-35), fibrinogen 118 mg/dL (interval 200-400), and D-dimer 4.2 mg/L FEU (interval less than 0.50). A prior PT was 12.2 s and fibrinogen was 286 mg/dL thirty hours earlier, so both have moved substantially.
The platelet count was verified on a peripheral smear with no platelet clumps seen, which reduces but does not erase a pseudothrombocytopenia concern for the current value. Falling platelets, prolonged PT and aPTT, low fibrinogen, and an increased fibrin-related marker together can support a consumptive coagulopathy pattern in the right clinical setting, but the serial trend and competing causes still matter, and a normal fibrinogen earlier in the trend would not have excluded evolving consumption, because fibrinogen is itself an acute-phase reactant that can start high and fall as it is consumed.
None of these four results, alone or together, names disseminated intravascular coagulation (DIC) or any other specific diagnosis. What they support is a clear, time-sensitive laboratory action: communicate the trend and the full pattern promptly through the local escalation procedure, confirm whether the analyzer or laboratory has a specific review requirement for this combination, and obtain the clinical context that determines whether a formal DIC assessment is appropriate. A DIC score and its cutoffs are governed by local procedure and current guidance.
A falling platelet count with a widening screen and rising D-dimer is a communicate-now pattern; the laboratory's job is to deliver the trend accurately and promptly, not to write the clinical diagnosis onto the report.
Illustrative drawing — this picture was drawn rather than captured.
| Test | First draw | Current draw | Interval |
|---|---|---|---|
| Platelets (x10^9/L) | 214 | 54 (via 96 midpoint) | 150-400 |
| PT (s) | 12.2 | 17.8 | 10.0-13.0 |
| Fibrinogen (mg/dL) | 286 | 118 | 200-400 |
| aPTT (s) | not reported at first draw | 48.6 | 25-35 |
| D-dimer (mg/L FEU) | not reported at first draw | 4.2 | less than 0.50 |
Knowledge checks
Reading and checks are open. Sign in only to save.
Knowledge check 1
Knowledge check 2
Section status
Finish this section
Reading and checks are open. Sign in only to save.
The module finishes after every required section is marked done and every check in those sections is correct.