Required section · Section 3 of 6
The variables that change what a number means
Sample SD and population SD are two different formulas applied to the same data, and they give two different numbers. Sample SD divides the sum of squared deviations by n minus 1; population SD divides by n. Quality control data conventionally uses the sample convention (n minus 1), but the procedure and the software or spreadsheet setting that actually produced a number must be declared, because the two conventions are not interchangeable and a mismatch will make two systems disagree on a number that should match.
Coefficient of variation restates SD as a percentage of the mean: CV equals 100 times sample SD divided by the sample mean. CV is meaningful mainly for ratio-scale data with a real, meaningful zero. As the mean approaches zero, CV becomes unstable or unhelpful, because dividing by a small number inflates the percentage without the underlying spread having changed. The same caution applies to percent bias: it is only interpretable when the target is nonzero, and the target concentration should be named alongside the percentage.
Bias in a comparison is the observed mean minus an assigned or comparison target, carrying the same unit as the result. A bias of 0.0 mmol/L against a stated target says the run's center matched that target; it says nothing about the spread of individual results around that center, which is what SD and CV describe separately.
Imprecision is often concentration dependent: a control's SD and CV at one concentration do not necessarily apply at another. Multiple control levels should be tracked and reported separately rather than pooled into one number, because pooling can hide a level-specific problem inside an average that looks fine overall.
A normal distribution, with a location parameter (the mean) and a scale parameter (the SD), is a common working assumption for control data, but normality is an assumption to assess, not a guarantee that comes free with any dataset. A standardized distance (a result minus the chosen mean, divided by the chosen SD) describes how far a result sits from the mean in SD units; it does not by itself establish whether that distance is acceptable.
Before comparing any two SD, CV, or bias numbers, confirm they came from the same denominator convention, the same control level, and a process believed stable across the window used to calculate them.
Illustrative drawing — this picture was drawn rather than captured.
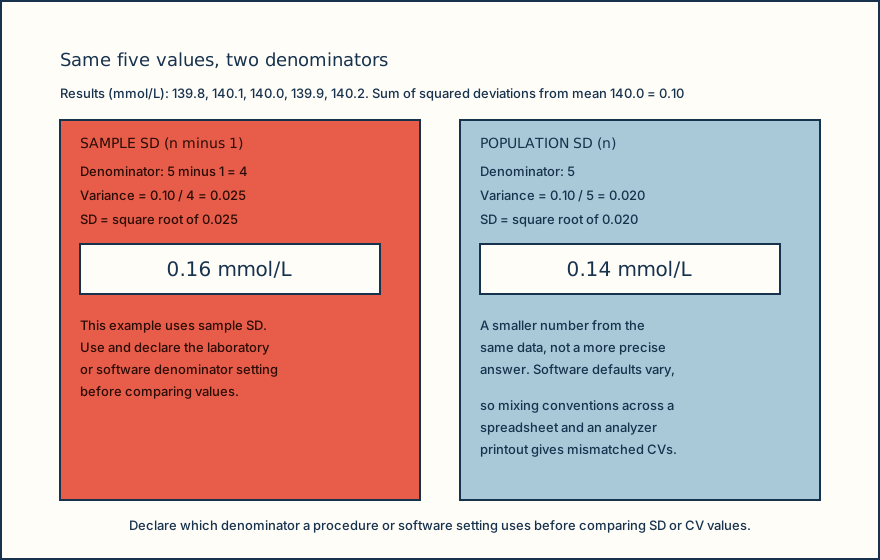
Illustrative drawing — this picture was drawn rather than captured.
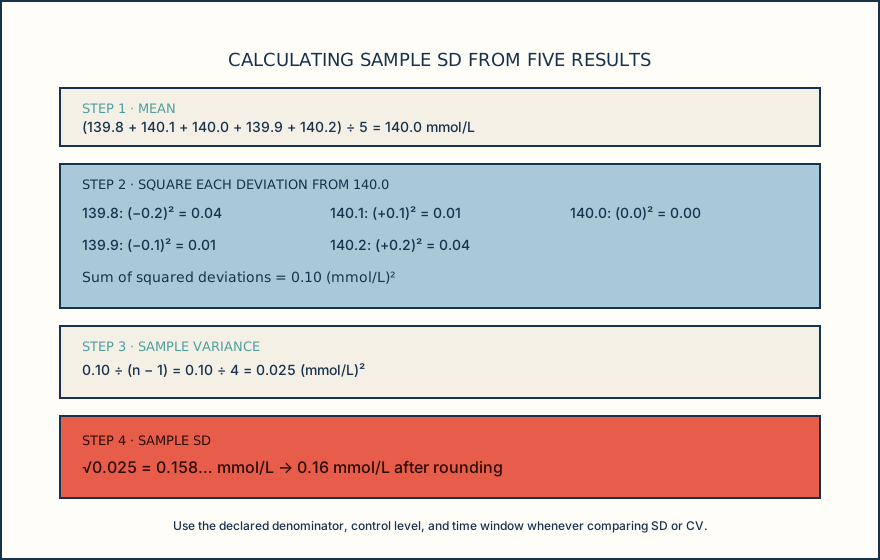
| Convention | Denominator | Variance (mmol/L squared) | SD (mmol/L) |
|---|---|---|---|
| Sample SD | n minus 1 = 4 | 0.025 | 0.16 |
| Population SD | n = 5 | 0.020 | 0.14 |
Knowledge checks
Reading and checks are open. Sign in only to save.
Knowledge check 1
Knowledge check 2
Section status
Finish this section
Reading and checks are open. Sign in only to save.
The module finishes after every required section is marked done and every check in those sections is correct.