Required section · Section 5 of 6
Learner decision: a ten-day drift, not an isolated high point
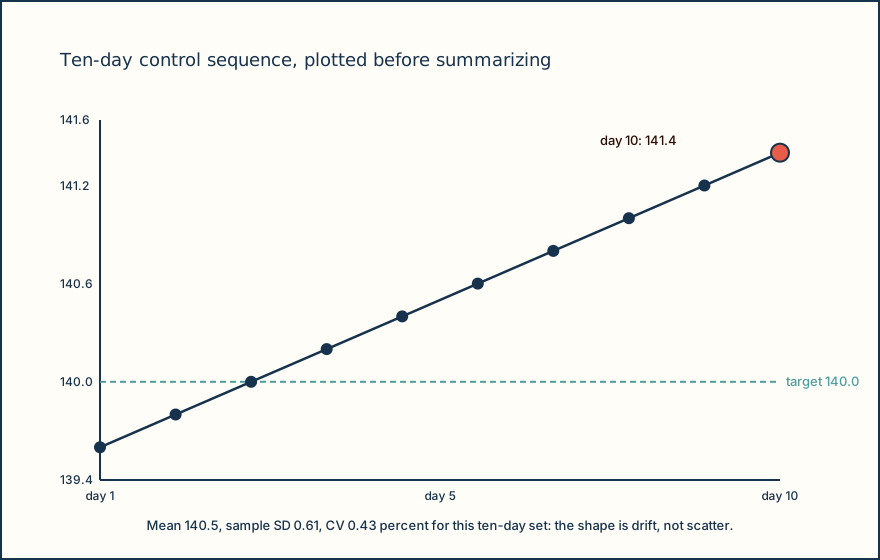
On a later ten-day sequence, the same Level 2 control results rise from 139.6 to 141.4 mmol/L in steady 0.2 mmol/L daily steps. Summary statistics for that window: mean 140.5 mmol/L, sample SD 0.61 mmol/L, CV 0.43 percent, bias against the 140.0 mmol/L target of plus 0.5 mmol/L. Every one of those numbers is larger than the single-run numbers in the guided example, but the number that matters most here is not visible in any of them.
The informative comparison is the time plot, not the summary statistics, because it exposes a monotonic drift: each day's result is higher than the last, in a steady step, which is a different pattern from random scatter around a stable center. A mean and SD calculated across this window blend a moving process into one static number and can make a real, ongoing shift look like ordinary spread.
The relevant decision is not which formula to apply again; it is which comparison is informative and what a defensible next step looks like. Summary statistics alone cannot name an assignable cause or establish that a local QC rule has been violated. Investigate per local procedure, including reagent lot, calibration, maintenance, and analyzer status, and do not remove the high late-day values to make the run's statistics look more like the earlier days.
A QC strategy includes control material, data, target values, SDs, frequency, schedules, and recovery from an out-of-control condition; it is defined locally, not by one universal rule. When a control event is unresolved or flagged by local rule, correct the affected process before releasing any tied patient results. If affected results were already released or reported before the event was resolved, immediately contain further release and follow the current procedure's lookback, correction, and notification route; do not wait for the cause investigation to close or use a statistical recalculation to make the event disappear.
Plot ten days before trusting a ten-day mean and SD, and treat a steady directional change as a different problem from an isolated high point, because the two call for different investigations.
Illustrative drawing — this picture was drawn rather than captured.
| Day | Result (mmol/L) |
|---|---|
| 1 | 139.6 |
| 2 | 139.8 |
| 3 | 140.0 |
| 4 | 140.2 |
| 5 | 140.4 |
| 6 | 140.6 |
| 7 | 140.8 |
| 8 | 141.0 |
| 9 | 141.2 |
| 10 | 141.4 |
Ordering exercise
Put these actions for the ten-day drift into a defensible order.
1. Investigate assignable causes per local procedure
Check reagent lot, calibration status, maintenance, and analyzer status rather than assuming a cause.
2. Document the event and escalate per local policy
Record the actual measurements, findings, and corrective action; escalate to the required reviewer or director oversight.
3. Plot the ten-day results in time order
See the pattern (steady drift versus scatter) before trusting the mean and SD calculated across the window.
4. Correct the affected process and hold or correct tied patient results
Address the process and any patient results run alongside the flagged control before release, per local procedure.
Knowledge checks
Reading and checks are open. Sign in only to save.
Knowledge check 1
Knowledge check 2
Section status
Finish this section
Reading and checks are open. Sign in only to save.
The module finishes after every required section is marked done and every check in those sections is correct.