Required section · Section 4 of 6
Guided calculation: one run, five results
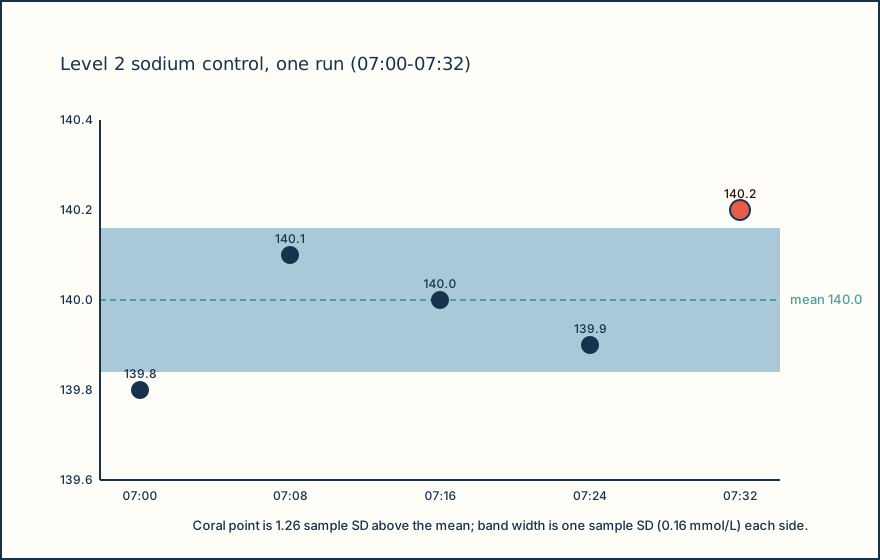
Setting: a Level 2 sodium control is measured at 07:00, 07:08, 07:16, 07:24, and 07:32 on one generic indirect ion-selective electrode analyzer after stable startup. Same control lot, reagent lot, calibration status, operator, and run are stipulated, no specimen is involved, and the assigned target is 140.0 mmol/L. No laboratory acceptance limits or QC rule set are supplied for this teaching case, so no pass or fail judgment is possible from these numbers alone.
Mean: (139.8 + 140.1 + 140.0 + 139.9 + 140.2) / 5 = 140.0 mmol/L. Sample SD, using n minus 1: square each result's deviation from 140.0, sum the squares to 0.10, divide by 4, and take the square root, giving 0.16 mmol/L. CV: 100 times (0.16 / 140.0) = 0.11 percent. Bias against the 140.0 mmol/L target: 140.0 minus 140.0 = 0.0 mmol/L, or 0.0 percent.
The 07:32 result, 140.2 mmol/L, sits 1.26 sample SD above this five-result mean: (140.2 minus 140.0) divided by 0.16. That number describes distance in SD units for this specific run; it is not a rejection signal, because no acceptance limit or QC rule was declared for this teaching case, and a standardized distance never authorizes a release decision by itself.
These values describe this short, stipulated dataset only. Five results give an imprecise estimate of a true mean and SD, so this run cannot by itself establish long-term precision, confirm normality, or authorize releasing patient results tied to this control event, because the laboratory's own acceptance criteria are what would make that call, and none were supplied here.
Keep the unit attached to every number you report (mmol/L for mean, SD, and bias; percent for CV), and state which SD convention and which time window produced it.
Illustrative drawing — this picture was drawn rather than captured.
| Time | Result (mmol/L) | Flag |
|---|---|---|
| 07:00 | 139.8 | none |
| 07:08 | 140.1 | none |
| 07:16 | 140.0 | none |
| 07:24 | 139.9 | none |
| 07:32 | 140.2 | none |
Knowledge checks
Reading and checks are open. Sign in only to save.
Knowledge check 1
Knowledge check 2
Section status
Finish this section
Reading and checks are open. Sign in only to save.
The module finishes after every required section is marked done and every check in those sections is correct.