Required section · Section 4 of 6
Walking the 07:00 and 11:00 runs
The guided case uses one morning quantitative run with two external control levels, target 100.0 U/L, laboratory SD 2.0 U/L, control range 94.0 to 106.0 U/L. The locally selected teaching rules are 1_2s as a warning, then 1_3s, 2_2s, R_4s, 4_1s, and 10x as rejection rules. At 07:00, run 1, the low control read 101.0 U/L (+0.5 SD) and the high control read 99.0 U/L (-0.5 SD). Neither value approaches a 1_2s cutoff of 102.0 or 98.0 U/L, so run 1 has no flag; patient results from run 1 are reportable.
At 11:00, run 2, the low control read 104.4 U/L, +2.2 SD, which alone triggers the 1_2s warning cutoff of 102.0 U/L. Read alone, that is a signal to look further, not a rejection. The high control from the same run read 104.6 U/L, +2.3 SD, also past the 102.0 U/L warning cutoff and on the same side. Two consecutive same-side results beyond 2 SD meet the definition of a 2_2s violation, which is a rejection rule in this laboratory's selected set. The run is rejected, and reporting from run 2 is held.
Reading the pattern: both flagged values are on the same side of the mean, both are moderate deviations rather than single extreme spikes, and the shift affects both control levels. That combination is most consistent with systematic error, something that shifted the whole measuring system's output, rather than a single random fluke. It is not proof of a specific cause. The next step is to check control preparation and storage, reagent lot and expiration, calibrator status, analyzer error messages, recent maintenance, and any other recent change, then correct whatever is found, rerun the required controls, verify they are acceptable, and document the event.
The remaining question is what happens to the three patient specimens run between the last acceptable QC event at 07:00 and the 11:00 rejection. Their analyte, reference range, and any critical value are deliberately not specified in this case; no assay instructions for use or local critical-value policy were supplied. The teaching point is to identify that 07:00-to-11:00 interval as the window for local patient-result review under your laboratory's lookback procedure, not to interpret or reclassify any specific patient value here.
Read the whole pattern, not just the number that first caught your eye; a value that looks moderate in isolation can be the second half of a rejection rule.
Illustrative drawing — this picture was drawn rather than captured.
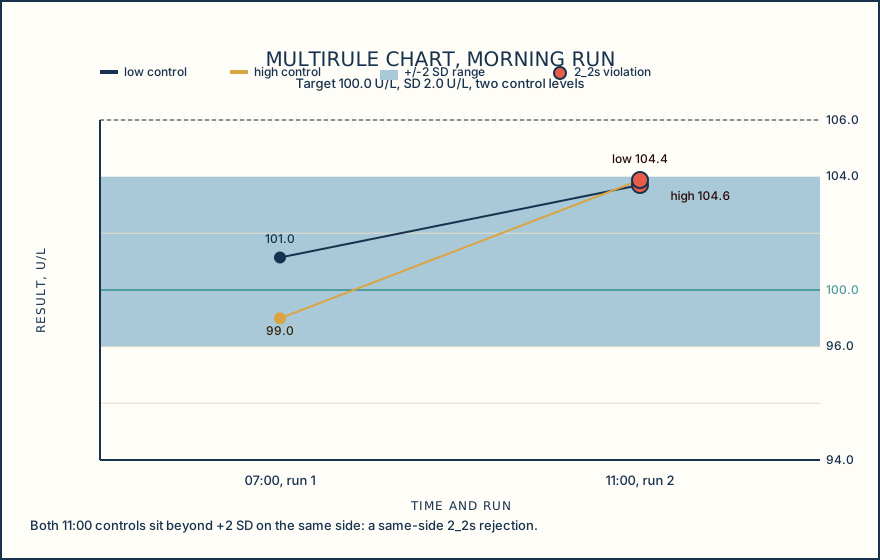
| Time and run | Level | Result (U/L) | Deviation | Rule reading |
|---|---|---|---|---|
| 07:00, run 1 | Low | 101.0 | +0.5 SD | None |
| 07:00, run 1 | High | 99.0 | -0.5 SD | None |
| 11:00, run 2 | Low | 104.4 | +2.2 SD | 1_2s warning |
| 11:00, run 2 | High | 104.6 | +2.3 SD | Same-side 2_2s rejection |
Knowledge checks
Reading and checks are open. Sign in only to save.
Knowledge check 1
Knowledge check 2
Section status
Finish this section
Reading and checks are open. Sign in only to save.
The module finishes after every required section is marked done and every check in those sections is correct.