Required section · Section 4 of 6
Working the five-level reagent-lot verification
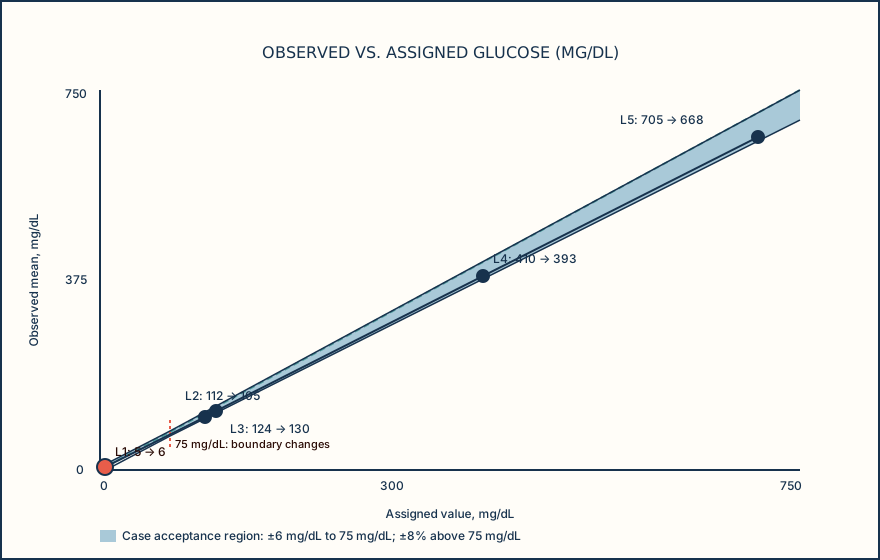
Five-level commercial calibration-verification material is tested under this case’s approved plan before the new reagent lot is released. The levels span low through high concentrations, including the clinical decision zone. The case acceptance criterion is ±8% or ±6 mg/dL, whichever is greater.
Level 1 is the one worth slowing down for. The assigned value is 5 mg/dL and the observed mean is 6 mg/dL, a difference of only 1 mg/dL but a striking-looking +20% difference. Read as a percentage alone, that looks like a failure. But the acceptance rule takes whichever limit is greater, and 8% of 5 mg/dL is only 0.4 mg/dL, so the governing limit here is the absolute 6 mg/dL term. A 1 mg/dL difference is well inside 6 mg/dL, so level 1 passes. This is why a criterion expressed only as a percentage misleads near the low end of a method's range, and why the low-concentration challenge point needs its own reading, not just a glance at percent recovery.
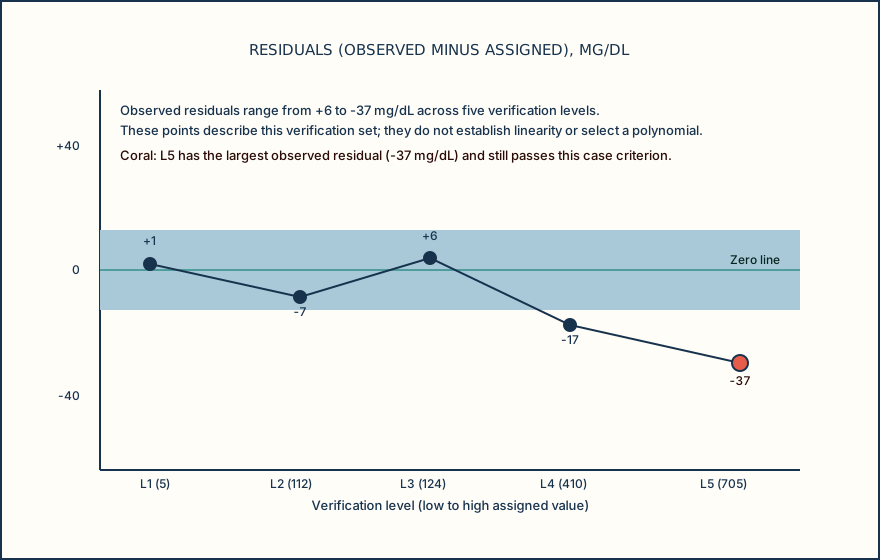
The remaining four levels are read the same way, difference and percent difference each compared against the calculated limit for that level. Level 2 (assigned 112, observed 105) differs by -7, well inside its 9.0 mg/dL limit. Level 3, inside the ADA decision zone (assigned 124, observed 130), differs by +6, inside its 9.9 mg/dL limit. Level 4 (assigned 410, observed 393) differs by -17, inside its 32.8 mg/dL limit. Level 5, near the AMR ceiling (assigned 705, observed 668), differs by -37, inside its 56.4 mg/dL limit. All five levels pass.
The residual plot shows the observed residuals at these five levels, including the failed high point in the separate post-maintenance scenario. These five verification levels neither establish linearity nor justify choosing a polynomial; they identify observations that need review under the approved plan.
Read the low-concentration point against the absolute term of the limit before concluding a large percent difference is a failure.
Illustrative drawing — this picture was drawn rather than captured.
Illustrative drawing — this picture was drawn rather than captured.
| Level | Assigned | Observed mean | Difference | % Difference | Acceptance limit | Result |
|---|---|---|---|---|---|---|
| 1 (low) | 5 | 6 | +1 | +20.0% | ±6 mg/dL (absolute term governs) | Pass |
| 2 (low-mid) | 112 | 105 | -7 | -6.3% | ±9.0 mg/dL | Pass |
| 3 (mid, decision zone) | 124 | 130 | +6 | +4.8% | ±9.9 mg/dL | Pass |
| 4 (mid-high) | 410 | 393 | -17 | -4.1% | ±32.8 mg/dL | Pass |
| 5 (high) | 705 | 668 | -37 | -5.2% | ±56.4 mg/dL | Pass |
| Level | Assigned (mg/dL) | Residual (mg/dL) |
|---|---|---|
| 1 | 5 | +1 |
| 2 | 112 | -7 |
| 3 | 124 | +6 |
| 4 | 410 | -17 |
| 5 | 705 | -37 |
Knowledge checks
Reading and checks are open. Sign in only to save.
Knowledge check 1
Section status
Finish this section
Reading and checks are open. Sign in only to save.
The module finishes after every required section is marked done and every check in those sections is correct.