Required section · Section 2 of 6
Calibration, calibration verification, AMR, and reportable range are four different things
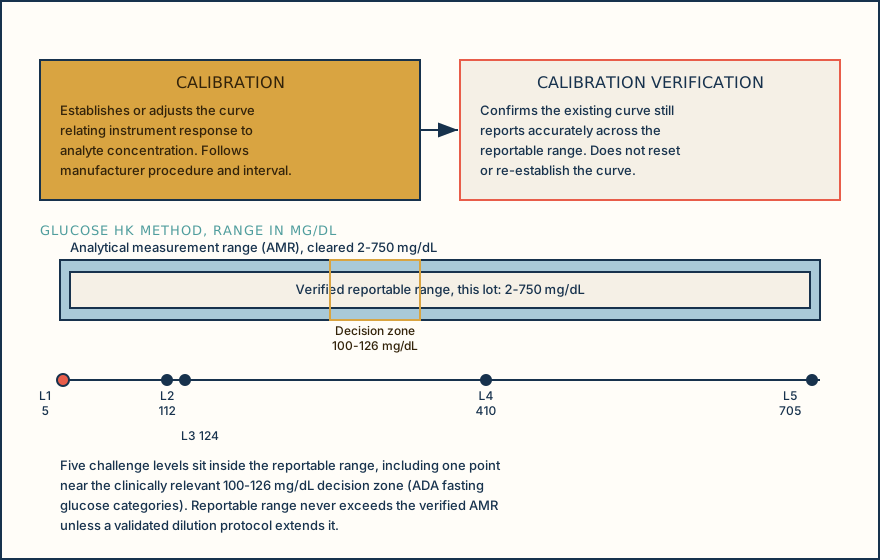
Calibration establishes or adjusts the relationship between what the instrument reads and the true concentration of the analyte. It follows the manufacturer's procedure and materials, on a schedule at least as frequent as the manufacturer recommends. Calibration verification is a different act: it confirms that a calibration already in place still produces accurate results across the laboratory's reportable range. It does not reset or re-establish the curve; it tests whether the existing curve still holds. Routine QC performed under the daily quality-control standard does not, by itself, satisfy the calibration-verification requirement, even when QC values look acceptable that same day.
Analytical measurement range (AMR) is the span of concentrations a method can measure directly on the specimen, with no dilution, concentration, or other nonroutine pretreatment. For this glucose method, the manufacturer's cleared AMR is 2.0 to 750 mg/dL (0.11 to 41.6 mmol/L, stated once here and given in mg/dL from this point on). Reportable range is a laboratory-level decision: it is the range of results the laboratory is authorized to report to clinicians. It may equal the verified AMR, or it may be narrower if the laboratory chooses not to verify the full AMR, and it may extend beyond the AMR only through a validated dilution or other approved pretreatment procedure, never by assumption.
The process map below lays out the calibration-verification workflow in the order a bench scientist actually performs it: choose materials placed across the range, run replicates, compare observed results to assigned values against a documented limit, evaluate the pattern of differences, then decide and document. Each later section fills in one step of that workflow with real numbers.
If a study only re-runs the manufacturer's calibrators through the existing curve without comparing observed results to assigned values against a stated limit, it has not demonstrated calibration verification.
Illustrative drawing — this picture was drawn rather than captured.
The calibration-verification workflow, from material selection to a documented go-live decision.
Select materials across the range
Choose materials the laboratory documents by lot number, type, and concentration, covering at minimum a low or minimal value, a midpoint value, and a value near the upper limit of the reportable range, with matrix and commutability considered.
Run replicates at each level
Test each level, typically in duplicate, under normal testing conditions, and record the actual observed values rather than only a pass or fail note.
Compare observed to assigned values
Calculate the difference and percent difference from the assigned target at each level and compare it against the laboratory's documented acceptance limit for that level.
Evaluate recovery, regression, and residuals
Look at the pattern across all levels: consistent recovery, a linear regression of observed versus assigned, and residuals, to decide whether the method behaves linearly across the tested range.
Decide and document readiness
Accept the range as verified, restrict the reportable range, recalibrate and repeat the study, or delay go-live, then document the actual measurements and the decision before implementation.
Knowledge checks
Reading and checks are open. Sign in only to save.
Knowledge check 1
Knowledge check 2
Section status
Finish this section
Reading and checks are open. Sign in only to save.
The module finishes after every required section is marked done and every check in those sections is correct.