Required section · Section 4 of 6
Guided case: depleted-store pattern
An adult outpatient specimen was collected in EDTA for CBC and serum for iron studies at the same morning draw. The EDTA specimen is not hemolyzed or clotted. The CBC uses automated impedance or optical RBC counting with photometric hemoglobin, calculated MCV and RDW, followed by manual smear review for flags or local criteria.
Hemoglobin is 94 g/L, RBC count 4.18 × 10^12/L, MCV 72 fL, MCH 22 pg, and RDW 17.8%. The smear shows hypochromia, anisopoikilocytosis, and occasional pencil forms, without reported target-cell predominance, coarse basophilic stippling, or dimorphism. These findings make the increased RDW and low MCV meaningful but remain supporting evidence.
Iron is 5 micromol/L, TIBC 76 micromol/L, ferritin 8 micrograms/L, and C-reactive protein (CRP) 2 mg/L. TSAT = 5 ÷ 76 × 100 = 6.6%, reported as 7% after the local rounding rule. An 81% value would result from reversing the division (76 ÷ 5 × 100) and is not TSAT. Low ferritin, low iron and TSAT, increased TIBC, increased RDW, and the smear fit established iron deficiency more closely than the thalassemia-pattern or inflammation pattern.
This pattern does not identify the cause of deficiency or make a patient diagnosis. Release verified results and follow local procedure for a bounded interpretive comment or authorized follow-up communication. The display intervals are teaching values and must be replaced by local verified population-, method-, and sex-specific intervals.
Preserve the calculation inputs, analyzer flags, smear findings, and relevant history in the review record required by local policy.
Illustrative drawing — this picture was drawn rather than captured.
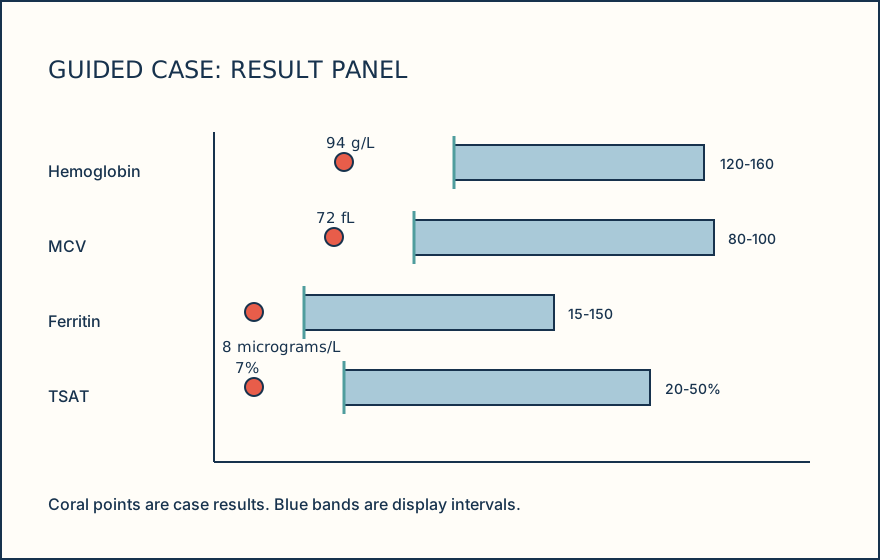
| Analyte | Result | Display interval | Method or observation |
|---|---|---|---|
| Hemoglobin | 94 g/L | 120-160 g/L | Photometric hemoglobin |
| RBC count | 4.18 × 10^12/L | 3.80-5.20 × 10^12/L | Automated impedance or optical count |
| MCV | 72 fL | 80-100 fL | Calculated |
| RDW | 17.8% | 11.5-14.5% | Calculated |
| Ferritin | 8 micrograms/L | 15-150 micrograms/L | Immunoassay |
| Iron | 5 micromol/L | 9-30 micromol/L | Colorimetric chemistry |
| TIBC | 76 micromol/L | 45-72 micromol/L | Measured or calculated locally |
| TSAT | 7% | 20-50% | Calculated: serum iron / TIBC x 100 |
| CRP | 2 mg/L | below 5 mg/L | Local method |
Knowledge checks
Reading and checks are open. Sign in only to save.
Knowledge check 1
Section status
Finish this section
Reading and checks are open. Sign in only to save.
The module finishes after every required section is marked done and every check in those sections is correct.