Required section · Section 4 of 6
Working the panel, pad by pad
Return to the opening panel. pH 8.5 sits just above the manufacturer's healthy-population example range of 4.6 to 8.0; specific gravity 1.010 and urobilinogen 0.2 mg/dL both sit inside their example ranges of 1.001 to 1.035 and up to 1.0 mg/dL. An alkaline pH by itself does not establish a cause; it can reflect diet, a delayed or poorly preserved specimen, or a genuine biologic process, and none of those can be told apart from the pH pad alone.
Protein, glucose, and ketone are negative, each below this strip's approximate sensitivity for its direct target, and bilirubin is negative. Those results do not establish absence at collection: protein is albumin-predominant and can miss nonalbumin protein, ketone does not detect beta-hydroxybutyrate, and every negative result is limited by the pad's sensitivity and by specimen handling. Delayed or improperly protected urine can lower bilirubin, and delay can alter other analytes; a negative is therefore bounded by the target, the assay limit, and the specimen's preanalytic history.
Blood 2+, nitrite positive, and leukocyte esterase 2+ are different. Blood is direct for heme, but heme can come from intact red cells, free hemoglobin, or myoglobin, so the pad cannot prove which source is present. Nitrite directly detects nitrite but is a clinical surrogate for bacterial nitrate reduction, and leukocyte esterase directly detects granulocyte esterase activity but is a clinical surrogate for white cells, not a white-cell count. Microscopy on the same specimen reports 25 to 50 white blood cells per high-power field, 10 to 20 red blood cells per high-power field, and many bacteria.
Put together, the microscopy result is consistent with the direct heme signal and with the two clinical-surrogate signals: red cells on the slide support the blood-pad reaction, white cells support the leukocyte-esterase reaction, and bacteria are consistent with a positive nitrite. That correlation is the most the strip and slide can jointly support here. It does not by itself establish a diagnosis, and it does not distinguish hematuria from hemoglobinuria or myoglobinuria beyond what the visible red cells already show. State that the panel and microscopy correlate, then communicate and, if indicated, escalate the finding under the laboratory's microscopic-review and communication policy without naming a diagnosis.
Correlate direct pad signals and clinical-surrogate relationships against the microscopic finding before drawing any conclusion, and stop the note at what was observed.
Illustrative drawing — this picture was drawn rather than captured.
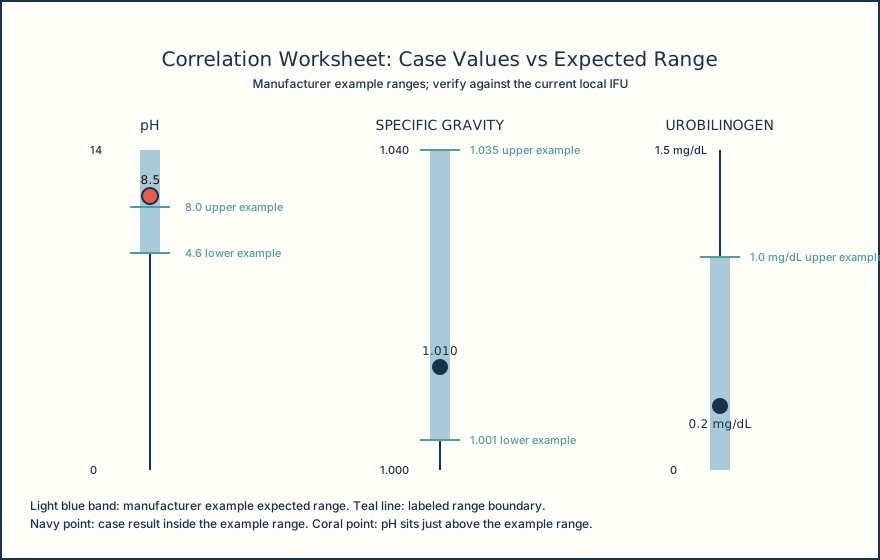
| Pad | Case result | Manufacturer example range |
|---|---|---|
| pH | 8.5 | 4.6 to 8.0 |
| Specific gravity | 1.010 | 1.001 to 1.035 |
| Urobilinogen | 0.2 mg/dL | Up to 1.0 mg/dL |
| Chemistry pad | Pad result | Microscopic finding |
|---|---|---|
| Blood | 2+ | Red blood cells 10 to 20/high-power field |
| Leukocyte esterase | 2+ | White blood cells 25 to 50/high-power field |
| Nitrite | Positive | Many bacteria seen |
Knowledge checks
Reading and checks are open. Sign in only to save.
Knowledge check 1
Knowledge check 2
Section status
Finish this section
Reading and checks are open. Sign in only to save.
The module finishes after every required section is marked done and every check in those sections is correct.