Required section · Section 3 of 6
Cells, artifacts, and the patterns they build
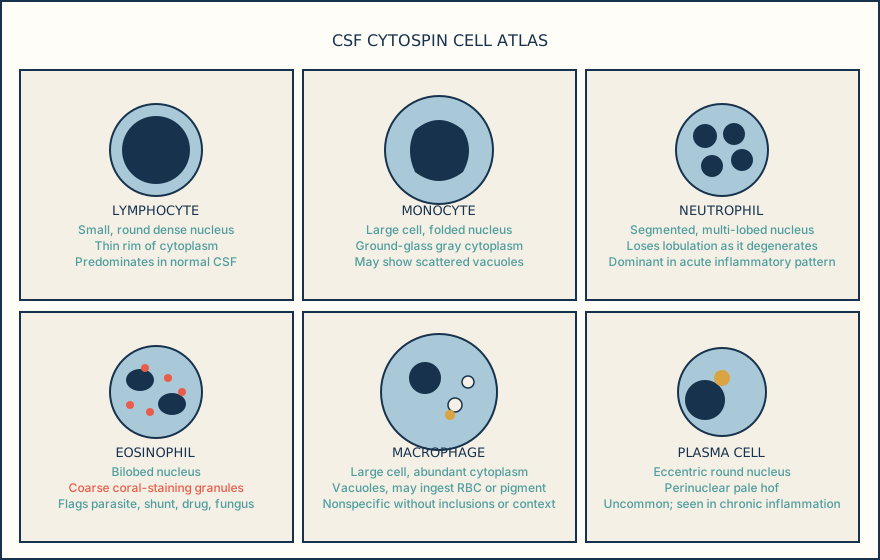
Identify a cell from what you can see before you name it: size relative to neighboring cells, nuclear shape and chromatin, cytoplasmic color and granularity, and any inclusion. A lymphocyte is small with a round, dense nucleus and only a thin rim of cytoplasm; it predominates in normal CSF. A monocyte is larger, with a folded or kidney-shaped nucleus and gray, sometimes vacuolated cytoplasm. A neutrophil has a segmented, multi-lobed nucleus, and that lobulation is exactly what degeneration blurs first, so a degenerating neutrophil can start to look deceptively like a mononuclear cell. An eosinophil has a bilobed nucleus and coarse granules and, by convention, eosinophilic meningitis is defined as at least 10 eosinophils per microliter or at least 10 percent of the CSF leukocyte differential. Plasma cells are uncommon in CSF and show an eccentric nucleus with a pale perinuclear hof. Lining cells, shed from the meninges or choroid plexus, can appear singly or in cohesive groups and should not be mistaken for an abnormal population just because they cluster.
Cytocentrifugation and low cell numbers both produce their own look-alikes. Distortion from spinning can flatten or smear a cell so its true nuclear shape is not reliable, and a very low-cellularity specimen forces you to identify a handful of cells with less context than a well-populated slide provides. Preparation quality and cellular distribution have to be assessed before a cell is assigned an identity, and a degeneration comment on the report is not a hedge, it is the qualifying fact a clinician needs to weigh the result correctly.
Named patterns describe the differential, not a diagnosis. A neutrophil-predominant differential supports an acute inflammatory process but is not by itself diagnostic of bacterial meningitis, because early viral illness, hemorrhage, chemical irritation, and other conditions can also produce a neutrophilic CSF. A lymphocytic or mononuclear-predominant pattern is equally nonspecific and needs correlation with protein, glucose, microbiology, collection context, and clinical information before anyone draws a conclusion from it. Eosinophils, when present at the conventional threshold, can reflect parasitic disease but also blood, a shunt or other implanted hardware, drugs, fungal infection, or malignancy, so an eosinophilic pattern raises a list of possibilities, not one answer.
A macrophage on its own tells you very little; it is nonspecific unless an inclusion or the collection context adds evidence. Two inclusions carry real meaning: erythrophagocytosis, a macrophage that has ingested red cells, and siderophages, macrophages containing hemosiderin from breaking down those red cells. Erythrophages do not form when blood and CSF are simply mixed together outside the body, so seeing them favors bleeding that happened before collection over a traumatic tap during collection, but neither erythrophagocytosis nor siderophages can precisely date a hemorrhage, because how quickly they appear and how long they persist varies.
Reactive lymphocytes complicate identification further. A reactive lymphocyte can enlarge, develop basophilic cytoplasm, or show a visible nucleolus, and those same features overlap with blast-like malignant cells on a cytospin. A monomorphic population with a high nuclear-to-cytoplasmic ratio, fine chromatin, and prominent nucleoli should prompt referral to a qualified reviewer, not an independent malignant diagnosis read off the slide, and cytospin morphology has limited sensitivity for rare malignant cells, particularly in a low-cellularity or delayed specimen. When available, multiparameter flow cytometry is an adjunct for appropriate specimens with suspected or equivocal hematolymphoid involvement, and it is read together with morphology, specimen quality, and known phenotype, because discordant cytology and flow results can reflect low cell number, degradation, sampling variation, or different analytic thresholds rather than a wrong answer on either side.
Name what you see, qualify it with preparation quality, and let the pattern and correlated results, not one cell in isolation, carry the interpretation.
Illustrative drawing — this picture was drawn rather than captured.
| Age group | Reference statistic | Value (cells/uL) |
|---|---|---|
| Adult, lumbar CSF at this case laboratory | Validated adult TNC interval | 0 to 5 cells/uL |
| Infant, 0 to 28 days | 95th percentile (Thomson cohort) | 14 |
| Infant, 29 to 60 days | 95th percentile (Thomson cohort) | 7 |
| Infant, 61 to 90 days | 95th percentile (Thomson cohort) | 11 |
| Time from collection | Reported effect |
|---|---|
| Within about 60 minutes | Recommended window for manual cellular analysis in the studied drainage-system specimens |
| 91 to 150 minutes | Associated with lower cell counts and more disintegrated cells |
Knowledge checks
Reading and checks are open. Sign in only to save.
Knowledge check 1
Knowledge check 2
Knowledge check 3
Section status
Finish this section
Reading and checks are open. Sign in only to save.
The module finishes after every required section is marked done and every check in those sections is correct.