Required section · Section 1 of 6
A Lavage Comes Back With More Lymphocytes Than Expected
A bronchoscopy is performed for new bilateral ground-glass opacities on chest imaging. The pulmonologist wedges the bronchoscope in the right middle lobe and performs a bronchoalveolar lavage (BAL): 200 mL of saline is instilled in four aliquots and 68 mL is recovered, 34% of what went in. The fluid arrives in the lab within 30 minutes, pale yellow and mildly turbid, with no gross blood and no milky flocculent material. A cytocentrifuge (cytospin) slide is stained with Wright-Giemsa and 400 nucleated cells are counted.
The differential comes back: alveolar macrophages 58%, lymphocytes 32%, neutrophils 6%, eosinophils 2%, squamous epithelial cells 2%. Total nucleated cell count is 220 cells per microliter. Macrophages are well below what a healthy nonsmoking adult typically shows, lymphocytes are more than double the upper end of that same reference range, and neutrophils and eosinophils each cross their own pattern threshold as well, though by a much smaller margin than lymphocytes. Before anything is said about what that might mean clinically, two bench questions come first: is this specimen good enough to trust, and what exactly is being counted.
Judging a BAL differential starts with judging the specimen, not the numbers. A low recovered volume, heavy contamination with upper-airway cells, obscuring mucus, or degenerated cells can all produce a differential that looks abnormal for reasons that have nothing to do with the patient's lungs. Only after adequacy is established does the differential itself become evidence worth interpreting, and even then it is supportive evidence, not a diagnosis.
The work covers how a BAL specimen is made, what a normal differential looks like, how to judge whether a given specimen is adequate and well prepared, how to read macrophage pigment and hemosiderin, and where a pattern stops being a bench-level descriptive finding and starts requiring pathology or microbiology review. The case above is followed through and revisited in the guided example.
A differential percentage means nothing until the specimen behind it has been judged adequate to interpret.
Illustrative drawing — this picture was drawn rather than captured.
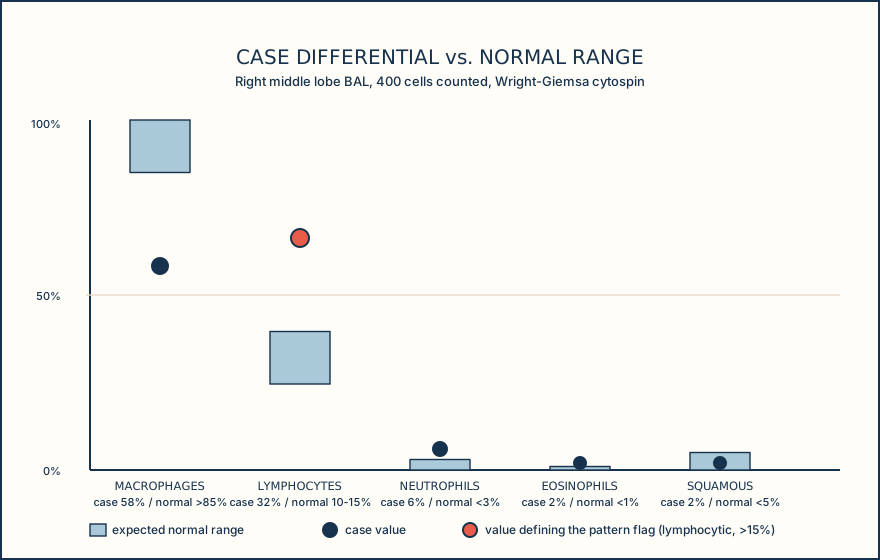
| Cell type | Case result | Expected nonsmoking-adult range |
|---|---|---|
| Alveolar macrophages | 58% | Above 85% |
| Lymphocytes | 32% | 10-15% (CD4:CD8 about 0.9-2.5) |
| Neutrophils | 6% | Under 3% |
| Eosinophils | 2% | Under 1% |
| Squamous/ciliated epithelial cells | 2% | Under 5% |
Knowledge checks
This section has no knowledge checks.
Section status
Finish this section
Reading and checks are open. Sign in only to save.
The module finishes after every required section is marked done and every check in those sections is correct.