Required section · Section 3 of 6
Curve Types, Triggers, and the Floor
Not every method calibrates the same way. A single-point calibration assumes a fixed, well-characterized relationship, such as a pre-characterized reagent blank, and runs one calibrator to anchor it. A multipoint calibration runs several calibrators across the range and fits a curve, linear for a method whose signal rises in direct proportion to concentration, nonlinear (spline, logistic, polynomial) for methods like many immunoassays whose dose-response curve is sigmoidal rather than straight. Many analyzers also carry lot-specific calibration data, a reagent-lot-specific master curve supplied by the manufacturer and adjusted locally with a smaller verification or a two-point adjustment, rather than a full multipoint calibration at every reagent lot change. Which design applies to a given method is a manufacturer instructions-for-use (IFU) decision, not a universal rule.
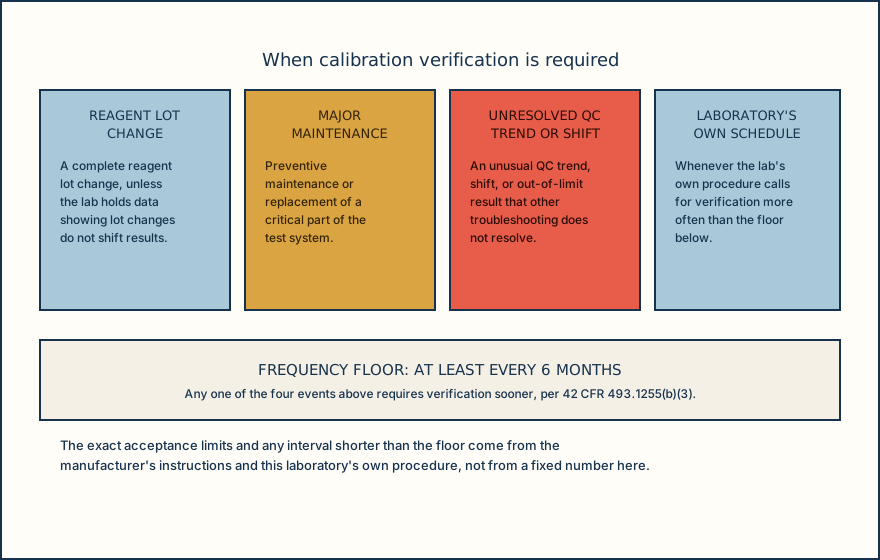
Calibration verification is required on a defined schedule, not left to judgment alone. Under CLIA, it is required at least every 6 months, and sooner after any of four named events: a complete reagent lot change, unless the laboratory holds data showing lot changes do not affect the reportable range or control values; major preventive maintenance or replacement of a critical part; an unusual QC trend, shift, or out-of-limit result that other troubleshooting does not resolve; and whenever the laboratory's own procedure calls for it more often. The 6-month figure and the four triggers are a floor set by CLIA. A laboratory's own policy and the manufacturer's instructions can require verification more often; any shorter interval is method- and policy-specific.
This is also why the opening scenario matters: routine QC at one or two levels, run daily, is not calibration verification and does not substitute for it. QC can miss bias or nonlinearity at the low or high end of the range precisely because it rarely tests those ends. A low/mid/high calibration verification study is built to catch exactly the kind of high-end drift seen in the glucose example.
Three related concepts bound what a calibrated system can report at the low end. Limit of blank (LoB), limit of detection (LoD), and limit of quantitation (LoQ) describe the lowest signal a system can distinguish from noise and still report with a stated confidence, with LoB less than LoD, and LoD less than or equal to LoQ. A value can sit mathematically on the fitted curve and still be below the LoQ, meaning the system was never shown to measure that low a concentration with acceptable accuracy. Detection capability and calibration are related but separate performance characteristics.
Know your method's curve type and your laboratory's verification schedule before you need them, because the trigger events, not the calendar alone, are what call for action between scheduled checks.
Illustrative drawing — this picture was drawn rather than captured.
| Curve design | Typical chemistry example | Why this design fits |
|---|---|---|
| Single-point | Fixed, pre-characterized reagent blank method | The signal-to-value relationship is stable enough to anchor with one calibrator |
| Multipoint linear | Direct photometric assay (e.g. Analyte X) | Signal rises in proportion to concentration across the range |
| Multipoint nonlinear | Immunoassay with sigmoidal dose-response | Signal response flattens at the low and high ends of the curve |
| Lot-specific master curve | Reagent-lot-coded chemistry or immunoassay | Manufacturer supplies a per-lot curve, adjusted locally rather than rebuilt fully |
Knowledge checks
Reading and checks are open. Sign in only to save.
Knowledge check 1
Knowledge check 2
Section status
Finish this section
Reading and checks are open. Sign in only to save.
The module finishes after every required section is marked done and every check in those sections is correct.