Required section · Section 1 of 6
A Verification Run That Almost Passed
You are reviewing a calibration verification run on the chemistry analyzer's glucose method. The method is a photometric glucose assay, reported in mg/dL, with an analytical measuring interval (AMI) of 0 to 400 mg/dL on this instrument. This laboratory's policy requires calibration verification (CV) at three levels, low, mid, and high, with each recovered value expected within plus or minus 10 percent of its target, consistent with the Clinical Laboratory Improvement Amendments (CLIA) requirement to check at least a minimal, a mid-point, and a high value near the top of the reportable range.
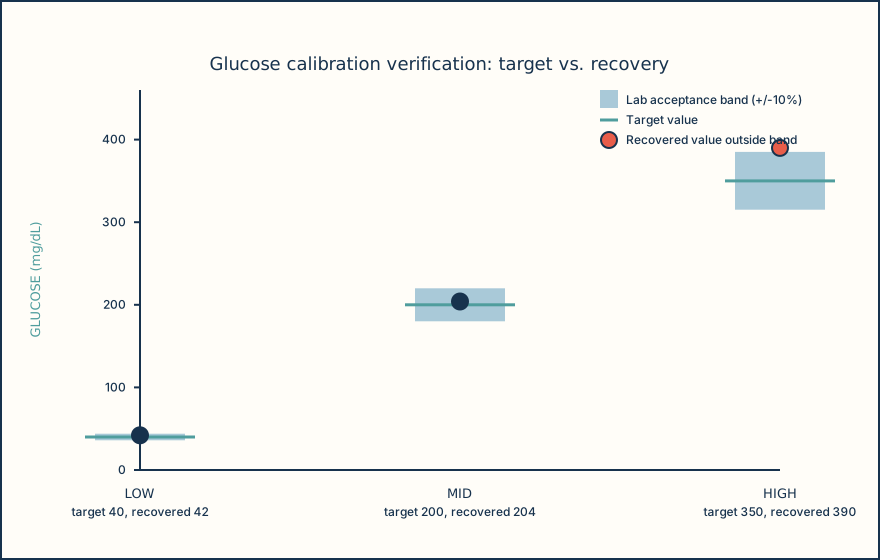
The low target is 40 mg/dL and recovers at 42 mg/dL, a 5 percent difference, within limit. The mid target is 200 mg/dL and recovers at 204 mg/dL, a 2 percent difference, within limit. The high target is 350 mg/dL and recovers at 390 mg/dL, an 11.4 percent difference, outside this laboratory's plus or minus 10 percent limit. Routine QC that morning, run at one normal-range level, had passed without comment.
The recovery chart below makes the pattern visible: the low and mid points sit inside the acceptance band around their targets, and the high point sits well above it. Nothing in the routine QC result predicted this, because routine QC does not test the top of the reportable range on this method.
Calibration, calibration verification, and QC are three separate, named activities with three separate purposes, and confusing them is how a drifted high end goes unnoticed.
A passing QC result tells you the levels QC actually tested are behaving, and nothing about the levels it did not test.
Illustrative drawing — this picture was drawn rather than captured.
| Level | Target (mg/dL) | Recovered (mg/dL) | Difference | Within lab limit |
|---|---|---|---|---|
| Low | 40 | 42 | +5.0% | Yes |
| Mid | 200 | 204 | +2.0% | Yes |
| High | 350 | 390 | +11.4% | No |
Knowledge checks
Reading and checks are open. Sign in only to save.
Knowledge check 1
Section status
Finish this section
Reading and checks are open. Sign in only to save.
The module finishes after every required section is marked done and every check in those sections is correct.