Required section · Section 3 of 6
Naming the pattern
An isolated extreme is a single point that sits far from the mean, often near or beyond 3 SD, with the points before and after it back near the mean. It is evidence to investigate, but a chart pattern by itself does not identify its cause; a single stray point can come from a pipetting slip, a bubble, a transient instrument event, or a real process problem, and the chart cannot distinguish between them.
Sustained results on one side of the established mean, run after run, are consistent with a shift, a pattern associated with possible systematic error such as a reagent, calibration, or instrument change that moved the whole process to a new level. A sustained progressive rise or fall across several consecutive points, rather than a single step, is consistent with a trend and can indicate a developing systematic change such as reagent degradation or drifting calibration. Increased scatter around the mean, with points swinging wider than the established baseline in both directions, is a pattern of reduced precision or possible random error and needs investigation in context. An alternating or cyclical appearance, where results repeatedly swing up and down on a recognizable schedule, is a monitoring signal to investigate timing and recurring conditions such as shift changes, temperature cycles, or reagent storage; it is not by itself a root-cause diagnosis.
Always compare more than one control level when more than one is run, because a pattern shared across levels carries different troubleshooting information than a pattern confined to a single level. A shift seen at both level 1 and level 2 at the same run points toward something common to the whole method, such as a reagent lot or a calibration. A shift confined to one level points more toward that specific control material or its handling.
None of these patterns are a diagnosis on their own. The chart is monitoring evidence: it tells you where to look, not what happened. Under 42 CFR 493.1256, control procedures must monitor accuracy and precision of the complete analytic process and must detect immediate errors while also tracking performance over time, including effects of system, environment, and operator variation. That is what the chart is built to do; deciding what caused a pattern requires looking beyond the chart itself, at the documented events around it. Name the pattern first, then go to the event log before you guess at a cause.
Illustrative drawing — this picture was drawn rather than captured.
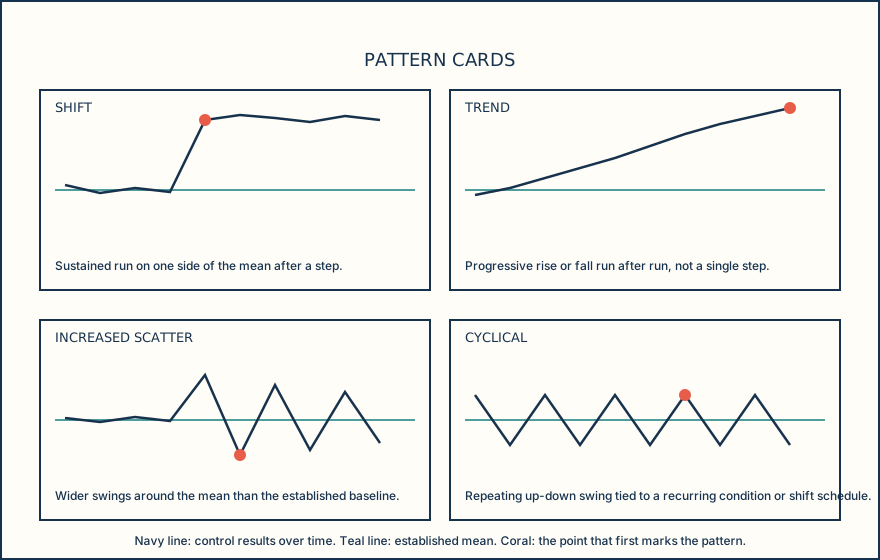
| Pattern | What it looks like | What it signals |
|---|---|---|
| Isolated extreme | One point far from the mean, neighbors near the mean | Investigate the single run; cause not identified by the chart alone |
| Shift | Sustained run on one side of the prior mean | Possible systematic error affecting the whole process level |
| Trend | Progressive rise or fall over several points | Possible developing systematic change, such as reagent or calibration drift |
| Increased scatter | Wider swings around the mean than baseline | Possible reduced precision or random error |
| Cyclical | Repeating up-down pattern on a recognizable schedule | Investigate recurring timing or environmental conditions |
Knowledge checks
Reading and checks are open. Sign in only to save.
Knowledge check 1
Knowledge check 2
Section status
Finish this section
Reading and checks are open. Sign in only to save.
The module finishes after every required section is marked done and every check in those sections is correct.