Required section · Section 4 of 6
Guided case: reading the chart across a lot change
Level 1 target mean is 100 mg/dL with SD 2 mg/dL. Level 2 target mean is 300 mg/dL with SD 5 mg/dL. Interpret the chart with the local analyzer, assay, reagent and control lots, and software version documented, because each can affect the significance of a lot-associated shift.
Reagent lot R17 is in use from Aug 3 through Aug 5. On Aug 6 at 06:55, reagent lot R18 is installed and QC is run before patient testing resumes, as required by the current approved procedure and applicable requirement. Level 1 reads 104 mg/dL, which is plus 2 SD. Level 2 reads 309 mg/dL, which is close to plus 2 SD (plus 1 SD is 305 mg/dL).
The first date the evidence changes is Aug 6, concurrent with the reagent lot change. Both levels move upward starting on that same run, so the pattern to name is a shift, and because it appears at both levels together, the preferred reading is a shared shift after the lot change rather than a problem confined to one control material. This is still monitoring evidence, not a conclusion: the chart shows that something changed at Aug 6, not that reagent lot R18 caused it.
The next step is not to redraw the mean or SD around the four post-change points to make them look acceptable; recalculating targets requires a valid baseline and a controlled transition under local policy, and doing it to erase an apparent shift would hide the very evidence the chart exists to show. Instead, inspect the documented lot-bridging comparison, calibration status, reagent storage and preparation record, analyzer flags, and the laboratory's QC procedure, in the order the local procedure specifies. Under 42 CFR 493.1256, controls must meet applicable laboratory and manufacturer acceptability criteria, and that determination must be documented, before patient results are released from an affected run. A shared shift at a lot change means investigate the transition record before releasing patient results, not redraw the limits.
Illustrative drawing — this picture was drawn rather than captured.
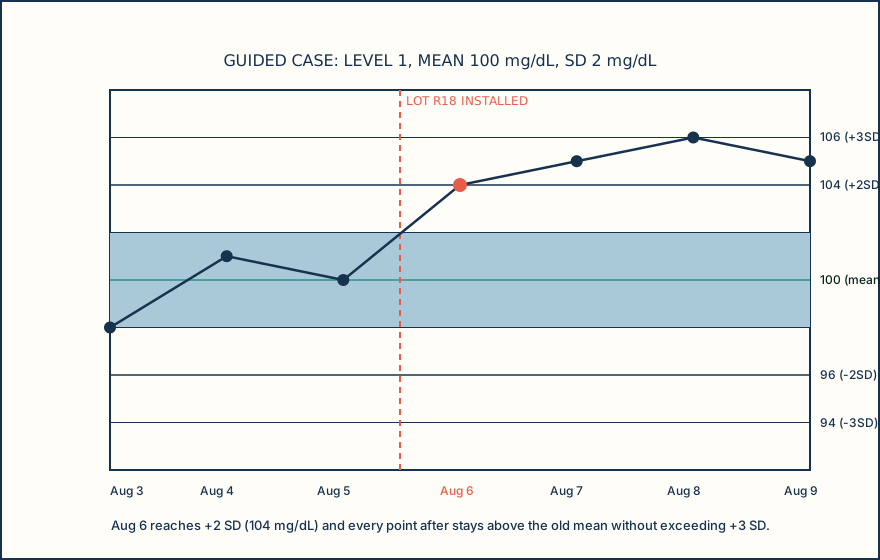
| Run date/time | Event or flag | Level 1, mg/dL | Level 2, mg/dL |
|---|---|---|---|
| Aug 3, 07:15 | Baseline, reagent lot R17 | 98 | 302 |
| Aug 4, 07:12 | Baseline | 101 | 297 |
| Aug 5, 07:14 | Baseline | 100 | 301 |
| Aug 6, 06:55 | Reagent lot R18 installed; QC before patient testing | 104 | 309 |
| Aug 7, 07:10 | No new event | 105 | 310 |
| Aug 8, 07:11 | No new event | 106 | 311 |
| Aug 9, 07:13 | No new event | 105 | 312 |
| Band | Expected percentage of points |
|---|---|
| Plus or minus 1 SD | About 68.27 percent |
| Plus or minus 2 SD | About 95.45 percent |
| Plus or minus 3 SD | About 99.73 percent |
Knowledge checks
Reading and checks are open. Sign in only to save.
Knowledge check 1
Knowledge check 2
Section status
Finish this section
Reading and checks are open. Sign in only to save.
The module finishes after every required section is marked done and every check in those sections is correct.