Required section · Section 3 of 6
Formulas, functions, and honest charts
Nonwaived test records must positively identify the specimen, record the date and time received, record the disposition of any unacceptable specimen, record testing dates, and record the identity of testing personnel (42 CFR 493.1283). A raw-data sheet built from an LIS export should already carry these fields; a spreadsheet analysis should reference them, not recreate them from memory. Data types matter here: a date/time field stored as text will not calculate correctly, a mixed-unit column will silently corrupt a comparison, and a duplicated specimen row will double-count in any SUMIFS or COUNTIFS total.
The functions that do the work in this kind of analysis are ordinary spreadsheet mechanics, not a cited clinical standard: SUMIFS and COUNTIFS total or count rows that meet one or more conditions, XLOOKUP (or an IFERROR-wrapped VLOOKUP or INDEX-MATCH) pulls a related value from a reference table by name instead of by column position, and IF or IFS branches a result into a flag based on the value and the test. Structured table references and named or dynamic ranges let a formula grow with the data instead of needing to be rewritten every time a row is added.
A missing result needs its own branch, not a blank left to be misread as zero. A quantity-not-sufficient (QNS) specimen has no numeric result; if a formula chain does not test for that case explicitly, a downstream SUMIFS or AVERAGE can silently include the blank as a zero and understate every summary statistic that touches it. This is exactly the kind of boundary case the audit checklist below exists to catch.
Retention and correction rules bound what the spreadsheet is allowed to do. Quality-control and patient-test records, including instrument printouts and analytic-system activity records, must be retained at least 2 years under the CLIA federal minimum (42 CFR 493.1105); a laboratory may keep records longer under state law, payer rules, or local policy, and that local retention schedule should be documented, not assumed. If a reported result is later found to be in error, the laboratory must promptly notify the ordering party, issue a corrected report, and retain both the original and corrected reports (42 CFR 493.1291); a workbook that overwrites a prior calculation without a version trail cannot support that requirement.
An honest chart follows the same discipline as an honest formula. CDC field-epidemiology guidance recommends a zero baseline for bar, column, and area charts, because a truncated baseline can make a small difference look disproportionately large; a line or scatter chart may omit a zero baseline for resolution, but that omission must be disclosed to the reader. Axis intervals should be equal and clearly labeled, and any axis break must be disclosed rather than silently compressed.
A run chart plots time-ordered data against a median or baseline to show whether a process changed; a Pareto chart ranks problem categories from most to least frequent with a cumulative-percentage line to prioritize what to investigate first; a difference plot (CLSI EP09c) puts the comparative-method result on the x-axis and the candidate-minus-comparative difference on the y-axis to visualize bias, with the Bland-Altman variant instead plotting against the mean of the two results with limits of agreement at the mean difference plus or minus 1.96 standard deviations.
A formula that cannot show its test cases and a chart that cannot show its axis choice are both being trusted on faith, and neither should be.
Illustrative drawing — this picture was drawn rather than captured.
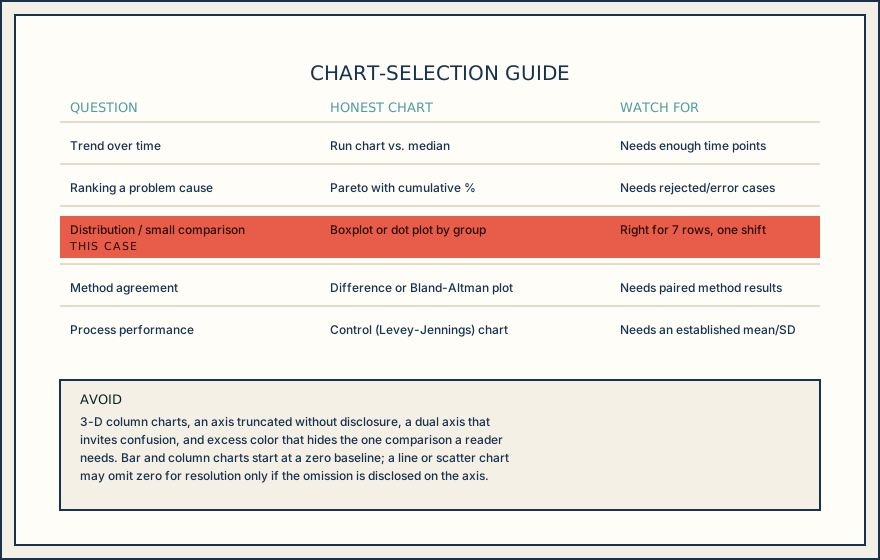
| Data question | Recommended chart | What it needs to be valid |
|---|---|---|
| Trend over time | Run chart against a median or baseline | Enough sequential time points to show a change |
| Ranking a problem cause | Pareto chart with cumulative percentage | A set of categorized rejection or error cases |
| Distribution or small group comparison | Boxplot or dot plot by group | Works even with a small, one-shift dataset |
| Method agreement | Difference plot or Bland-Altman plot | Paired results from two measurement procedures |
| Process performance over runs | Levey-Jennings control chart | An established mean and standard deviation |
Knowledge checks
Reading and checks are open. Sign in only to save.
Knowledge check 1
Knowledge check 2
Section status
Finish this section
Reading and checks are open. Sign in only to save.
The module finishes after every required section is marked done and every check in those sections is correct.