Required section · Section 1 of 6
A spreadsheet formula error is a patient-result error
A bench technologist opens the morning STAT chemistry summary and finds a turnaround-time (TAT) dashboard that looks clean: seven rows, a chart, a few flags. Nothing on the screen says whether any formula in that workbook is wrong. That is the problem with a spreadsheet error: it does not look like an error. A dropped parenthesis, a copied formula that shifted one row, or a blank cell treated as a zero produces a number that looks exactly as plausible as a correct one.
This is not a rare event. A synthesis of 14 controlled spreadsheet-development studies covering 967 participants found an average cell error rate of about 3.9%, with individual studies ranging roughly 1% to 17% depending on the task and how an error was defined. A separate field audit of 50 operational spreadsheets found errors affecting roughly 1.8% of formula cells overall, and one workbook in that audit had errors in 28% of its formula cells. A small per-cell error rate is enough to make an entire workbook materially wrong, especially once one erroneous cell is copied down a column.
Laboratory regulation treats this as a real risk, not a theoretical one. Under 42 CFR 493.1291, a CLIA-regulated laboratory must maintain systems, manual or electronic, that ensure patient-specific data and results are transmitted accurately, reliably, and in a timely manner from data entry through the final report, and that includes any calculated result. A spreadsheet that computes a flag, a turnaround time, or a summary statistic that reaches a report or a clinical decision is part of that chain, whether or not anyone thinks of it as 'the analyzer.'
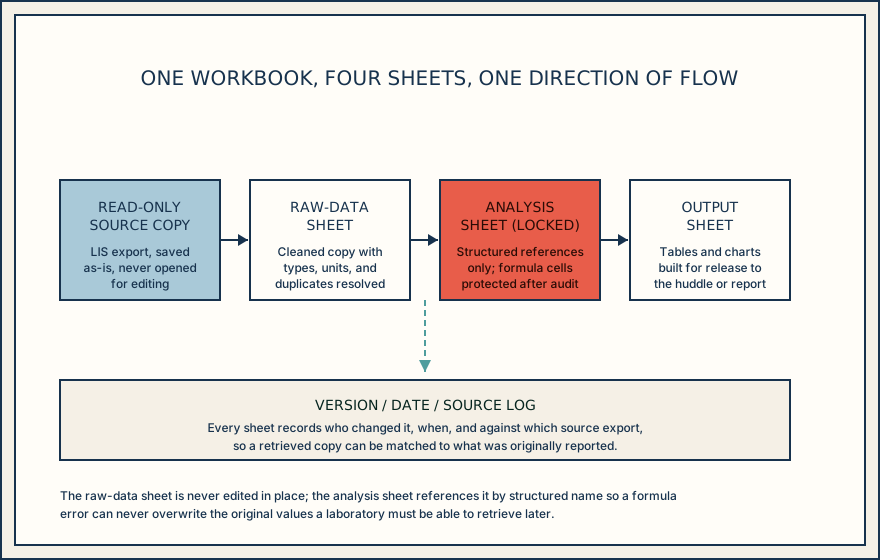
Use a small dataset as a bench technologist would: import it without touching the source, build formulas that are tested before they are trusted, and pick a chart that tells the truth about seven rows of data. Treat every formula that touches a patient result as a test-system component, not a convenience calculation.
Illustrative drawing — this picture was drawn rather than captured.
Knowledge checks
Reading and checks are open. Sign in only to save.
Knowledge check 1
Section status
Finish this section
Reading and checks are open. Sign in only to save.
The module finishes after every required section is marked done and every check in those sections is correct.