Required section · Section 3 of 6
What the detector reads, and what the software adds
The detector never reads a concentration. It reads a physical or chemical signal, and the analyzer's software converts that signal to a concentration or activity through the stored calibration curve. Most photometric assays follow the Beer-Lambert relationship: within a method's linear range, absorbance is proportional to the concentration of the light-absorbing product at a fixed wavelength and path length. The analyzer applies its own calibration curve to that relationship rather than relying on a textbook constant, because path length, reagent lot, and instrument optics all shift the real-world relationship slightly.
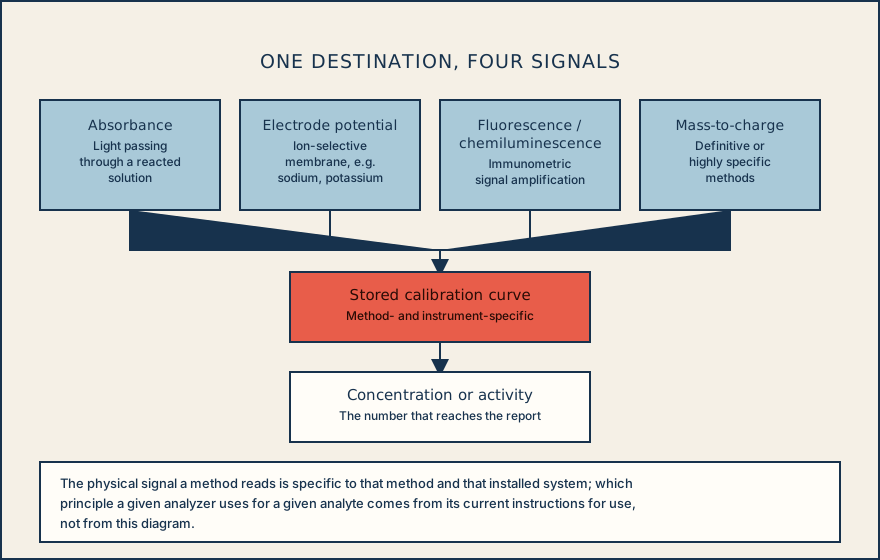
Absorbance photometry is common, but it is not the only detector principle in a chemistry laboratory. Reflectance is used in dry-slide chemistry. Ion-selective electrodes measure a membrane potential related to ion activity for analytes such as sodium and potassium. Amperometric and coulometric electrochemistry serve some analytes directly. Fluorescence and chemiluminescence amplify signal for many immunoassays. Mass-to-charge detection, mass spectrometry, is used for definitive or highly specific methods. Whichever signal a method reads, it funnels through a calibration curve to the same kind of output: a concentration or an activity. Which principle a specific installed method uses for a specific analyte is defined by that method's current instructions for use, not by this diagram.
Ion-selective electrode design matters for one common look-alike. Direct ISE, where undiluted specimen contacts the membrane, is common on point-of-care and blood-gas analyzers. Indirect ISE, where the specimen is pre-diluted before reaching the membrane, is common on large chemistry analyzers, and it assumes a normal plasma-water fraction. High lipid or high protein lowers the plasma-water fraction and can make indirect-ISE sodium falsely low, an effect called pseudohyponatremia. Low protein can shift indirect-ISE sodium in the opposite direction. Direct ISE is less affected by these plasma-water-fraction effects.
Timing strategy is method-specific too. Endpoint methods let the reaction go to completion, or near it, and then read a single stable absorbance. Kinetic, or rate, methods read absorbance repeatedly during the reaction and calculate the rate of change, delta A per minute, over a defined segment. Enzyme activity assays are typically kinetic, because activity is a rate by definition, and many concentration assays are typically endpoint, but the assignment is method-specific. Blanking, reading the reagent or specimen alone before the reaction signal is added, removes background absorbance that has nothing to do with the analyte, so it is not mistaken for analyte signal.
Not every number on a chemistry report is measured. Some are calculated from one or more measured values by a published equation. Serum creatinine, for example, is typically measured directly by a Jaffe or enzymatic reaction. Estimated glomerular filtration rate, eGFR, is always a calculated value, derived from measured creatinine, age, and sex, using a published equation such as the 2021 CKD-EPI creatinine equation. eGFR should never be read as though the analyzer measured filtration rate directly; it is an estimate built from a measured analyte and demographic inputs.
Two range concepts bound what a reportable number can mean. The analytical measurement range, AMR, is the span of values a method can measure directly on the specimen without dilution or other pretreatment, established chiefly through linearity studies. The reportable range is the range of patient results the laboratory has verified it can report, which can extend past the AMR through a validated dilution protocol. A result outside the AMR is not a true measured value until it is diluted and re-measured within range. On top of both ranges, many laboratories run autoverification: rules-based, software-mediated logic that checks QC status, instrument error flags, critical-value status, range status, and delta-check consistency against the patient's own prior result before releasing a result without manual review. Autoverification logic is validated by the laboratory and can vary between installations; it is local policy, not a universal standard. Know, for the analyte in front of you, whether the number is measured or calculated, what signal the method actually reads, and whether it falls inside the analyzer's verified reportable range before you interpret it.
Illustrative drawing — this picture was drawn rather than captured.
| Detection principle | What the detector reads | Typical use |
|---|---|---|
| Absorbance photometry | Light transmitted through a reacted solution | General chemistry assays, e.g. glucose, enzymes |
| Reflectance | Light reflected from a dry-slide reagent surface | Dry-slide chemistry systems |
| Potentiometry (ISE) | Membrane potential related to ion activity | Sodium, potassium, chloride |
| Amperometric/coulometric | Electrical current from an electrochemical reaction | Selected analytes, method-specific |
| Fluorescence/chemiluminescence | Emitted light from a labeled reaction | Immunoassay signal amplification |
| Mass-to-charge (mass spectrometry) | Ion mass-to-charge ratio | Definitive or highly specific methods |
Knowledge checks
Reading and checks are open. Sign in only to save.
Knowledge check 1
Knowledge check 2
Knowledge check 3
Section status
Finish this section
Reading and checks are open. Sign in only to save.
The module finishes after every required section is marked done and every check in those sections is correct.