Required section · Section 4 of 6
Working the calibration line: a glucose result
This example uses a reference-type enzymatic glucose method, hexokinase / glucose-6-phosphate dehydrogenase (hexokinase-G6PD); it is not tied to one named commercial instrument. Glucose is phosphorylated by hexokinase using ATP, and the resulting glucose-6-phosphate is oxidized while NADP+ is reduced to NADPH. NADPH absorbs light at 340 nm, and the rise in absorbance, delta A, is proportional to glucose concentration within the method's linear range. This is an endpoint method: the analyzer waits for the reaction to reach a stable plateau and reads delta A once, rather than tracking a rate.
Three calibrators establish the signal-to-concentration relationship for this run: a zero calibrator, a mid-level calibrator, and a high-level calibrator, each with an assigned glucose concentration. Their delta A values at 340 nm are 0.000 at 0 mg/dL, 0.300 at 100 mg/dL, and 0.900 at 300 mg/dL. Plotted against concentration, these three points fall on a straight line with a slope of 0.003 delta A per mg/dL, which is the calibration curve the analyzer stores and applies to every patient specimen run in this batch.
The patient specimen in this case produces a final delta A of 0.546 once the reaction plateaus, shown as the coral point on the endpoint curve below. Applying the calibration slope, 0.546 divided by 0.003 delta A per mg/dL, gives a reported glucose of 182 mg/dL. Two internal-consistency checks matter here. First, units are mg/dL throughout, calibrator and patient alike. Second, the patient's delta A of 0.546 falls between the mid and high calibrator readings, so the analyzer is interpolating within its calibrated range rather than extrapolating past the top calibrator, which is a more defensible position for the result to sit in.
The right-hand panel of the same figure shows a kinetic reaction on the same time axis for contrast, using a different analyte. Instead of waiting for a plateau, the analyzer reads absorbance repeatedly and calculates the rate of change, delta A per minute, over the segment where the reaction proceeds linearly. Neither approach is more correct in general; each is chosen for the chemistry of a specific method, endpoint for many concentration assays and kinetic for most enzyme activities.
This glucose value of 182 mg/dL sits inside an AMR of 10 to 500 mg/dL, so no dilution or rerun is needed before it can be reported. A fasting reference interval of roughly 70 to 99 mg/dL is shown for illustration only; the actual interval a laboratory reports is method- and population-specific and comes from that laboratory's own verified reference interval.
A reported concentration is only as trustworthy as the calibration line it was read against, so before you accept a number, know whether the patient's signal fell inside the calibrated range or had to be extrapolated beyond it.
Illustrative drawing — this picture was drawn rather than captured.
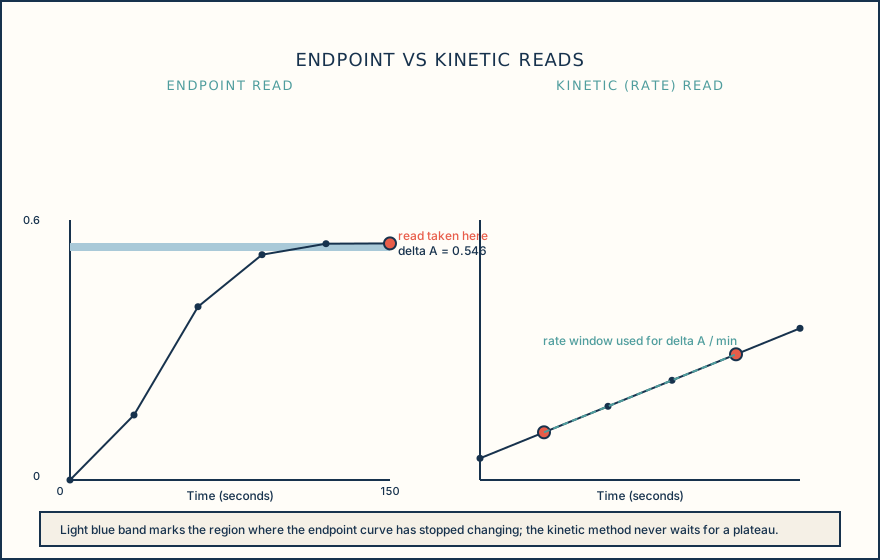
| Time (seconds) | Endpoint reaction, delta A at 340 nm | Kinetic reaction, delta A at 340 nm |
|---|---|---|
| 0 | 0.000 | 0.050 |
| 30 | 0.150 | 0.110 |
| 60 | 0.400 | 0.170 |
| 90 | 0.520 | 0.230 |
| 120 | 0.545 | 0.290 |
| 150 | 0.546 (read taken) | 0.350 |
Knowledge checks
Reading and checks are open. Sign in only to save.
Knowledge check 1
Knowledge check 2
Section status
Finish this section
Reading and checks are open. Sign in only to save.
The module finishes after every required section is marked done and every check in those sections is correct.