Required section · Section 4 of 6
Reading one arterial panel end to end
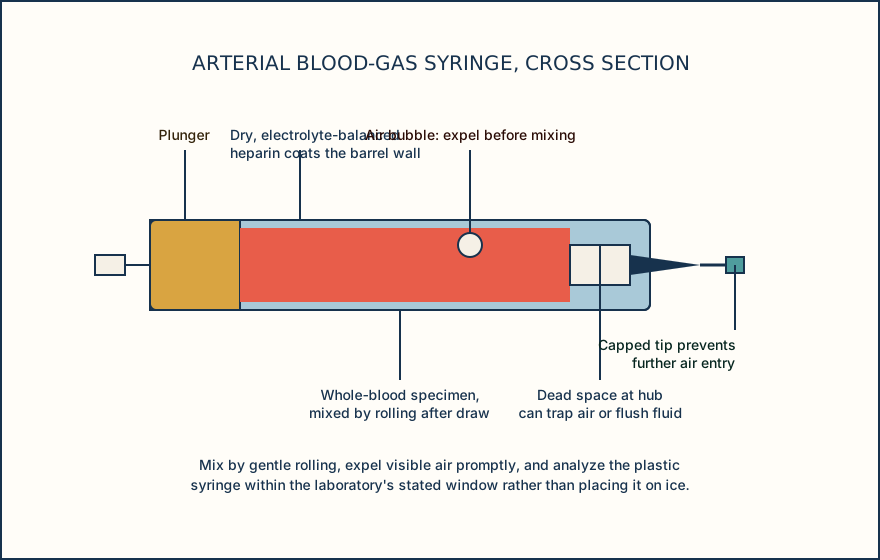
A ventilated adult patient has an arterial line. Respiratory therapy draws an arterial specimen into a dry, electrolyte-balanced heparin syringe after discarding an adequate line-flush volume, expels one small bubble immediately, caps the syringe, and walks it to the point-of-care analyzer. Time from draw to analysis is 6 minutes. Patient temperature is 37.0 degrees C, so no temperature correction is needed.
The reported panel: pH 7.31 (reference interval 7.35-7.45, measured), PCO2 52 mmHg (reference interval 35-45 mmHg, measured), PO2 68 mmHg (measured; the room-air reference interval of 80-100 mmHg does not apply because the patient is on 40% FiO2), HCO3- 25 mmol/L (reference interval 22-26 mmol/L, calculated from the measured pH and PCO2 by the Henderson-Hasselbalch relationship), base excess +0.5 mmol/L (calculated), and co-oximetry results of tHb 11.2 g/dL, FO2Hb 92%, FCOHb 1.1%, FMetHb 0.6% (all measured). Specimen flags: none. No bubble was carried into analysis, there is no clot, the fill was adequate, and the specimen was analyzed inside the laboratory's validated syringe/specimen/analyzer window.
Work the reasoning in order. First, pH is below the reference interval and PCO2 is above it, so the measured pair is consistent with an acute respiratory acidosis. Second, the calculated bicarbonate sits inside its own reference interval rather than rising to compensate, which is consistent with an acute process that has not yet triggered renal compensation; a chronic process would more often show a higher bicarbonate. Third, PO2 of 68 mmHg is low in absolute terms, but the analyzer has no way to know the patient is receiving supplemental oxygen. That number has to be read against the reported FiO2 of 40%, not against the room-air reference interval, because the reference interval in this ledger applies specifically to room air.
Fourth, near-zero COHb and MetHb make a dyshemoglobin-related calculated-versus-measured saturation discrepancy less likely here; they do not make every saturation discrepancy irrelevant. Fifth, the specimen has no defect flags, so the laboratory applies its local reporting procedure. Work measured values first, calculated values second, and specimen integrity last before offering an interpretation.
Illustrative drawing — this picture was drawn rather than captured.
| Parameter | Result | Reference interval | Measured or calculated |
|---|---|---|---|
| pH | 7.31 | 7.35-7.45 | Measured |
| PCO2 | 52 mmHg | 35-45 mmHg | Measured |
| PO2 | 68 mmHg (on 40% FiO2) | 80-100 mmHg on room air (not applicable here) | Measured |
| HCO3- | 25 mmol/L | 22-26 mmol/L | Calculated |
| Base excess | +0.5 mmol/L | approximately -2 to +2 mmol/L | Calculated |
| FCOHb / FMetHb | 1.1% / 0.6% | near zero expected | Measured, co-oximetry |
Knowledge checks
Reading and checks are open. Sign in only to save.
Knowledge check 1
Section status
Finish this section
Reading and checks are open. Sign in only to save.
The module finishes after every required section is marked done and every check in those sections is correct.