Required section · Section 4 of 6
Guided example
An adult outpatient specimen was received at 09:20 and tested at 10:05. Automated CBC on EDTA whole blood reports hemoglobin 11.2 g/dL, RBC 5.62 × 10^12/L, MCV 63.0 fL, MCH 19.9 pg, and RDW 13.2%. Local illustrative intervals are hemoglobin 12.0-16.0 g/dL, RBC 3.80-5.20 × 10^12/L, MCV 80-100 fL, MCH 27-33 pg, and RDW 11.5-14.5%. The analyzer flags microcytosis and hypochromia.
Ferritin collected the same day is 48 ng/mL against a local 15-150 ng/mL interval. That iron result does not support iron deficiency in this case. It also does not make the CBC independently diagnostic.
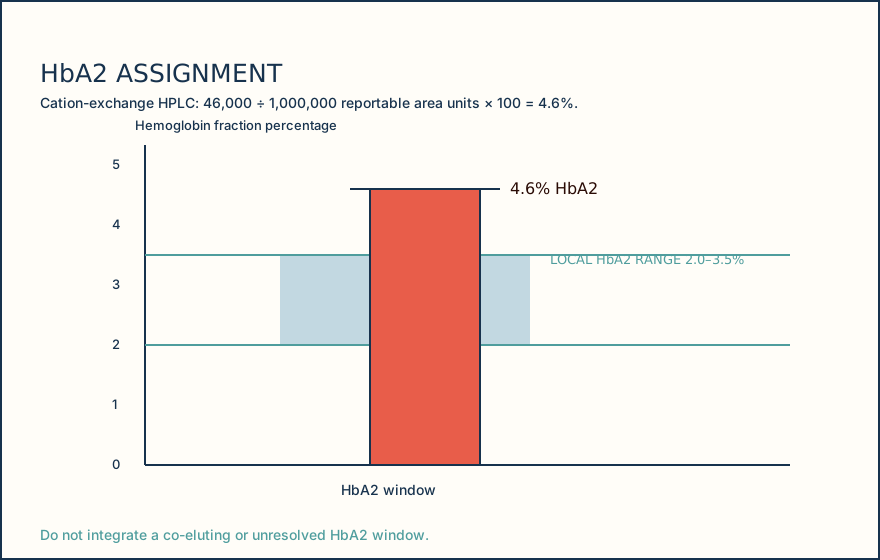
Cation-exchange HPLC on the local validated method reports HbA 94.8%, HbA2 4.6%, and HbF 0.6%, with no reportable variant peak. The local illustrative intervals are HbA2 2.0-3.5% and HbF 0.0-1.0%. No transfusion is documented in the preceding four months. Increased HbA2, marked microcytosis relative to mild anemia, relatively high RBC count, and nondeficient ferritin together support a beta-thalassemia carrier pattern.
The supported action is a bounded released interpretation under local policy, with molecular or family correlation when clinically requested or when the pattern is discordant. The fractionation pattern is not a genotype: this result does not establish an HBB genotype, exclude coinherited alpha-thalassemia, or exclude a method-limited variant. Release the evidence-supported pattern and its limits, not a genotype inferred from HbA2 alone.
Illustrative drawing — this picture was drawn rather than captured.
| Test | Result | Local illustrative interval | Interpretive contribution |
|---|---|---|---|
| Hemoglobin | 11.2 g/dL | 12.0-16.0 g/dL | Mild anemia |
| RBC count | 5.62 × 10^12/L | 3.80-5.20 × 10^12/L | Relatively increased |
| MCV | 63.0 fL | 80-100 fL | Marked microcytosis |
| Ferritin | 48 ng/mL | 15-150 ng/mL | Does not support iron deficiency in this case |
| HbA2 | 4.6% | 2.0-3.5% | Increased on local method |
| HbF | 0.6% | 0.0-1.0% | Within local illustrative interval |
| HbA | 94.8% | Not assigned in this teaching case | Reportable fraction; completes the fraction total |
Knowledge checks
Reading and checks are open. Sign in only to save.
Knowledge check 1
Knowledge check 2
Section status
Finish this section
Reading and checks are open. Sign in only to save.
The module finishes after every required section is marked done and every check in those sections is correct.