Required section · Section 4 of 6
Guided case: reading the worksheet
A clean-catch urine specimen arrives at the bench 90 minutes after collection, at ambient temperature. The worksheet documents the laboratory's own validated 10.0 mL aliquot, its validated centrifugation and resuspension steps, and a standardized coverslip preparation; these preparation values are not a procedure to copy.
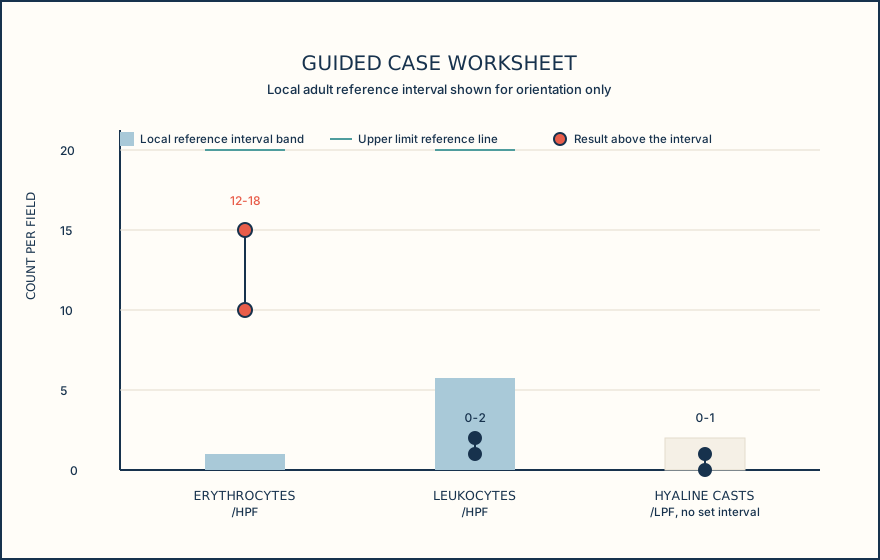
The technologist follows the fixed sequence: a full low-power scan of the coverslip first. Clarity is recorded as slightly hazy. No crystals are seen on the initial bright-field low-power scan, and hyaline casts are noted at 0 to 1 per low-power field, within the laboratory's category for that finding. The scan is even; nothing suggests a poorly mixed or unevenly loaded preparation.
Moving to high power in several representative fields, squamous epithelial cells are rare, leukocytes are 0 to 2 per high-power field against a local adult interval of 0 to 5 per high-power field, and erythrocytes are 12 to 18 per high-power field against a local adult interval of 0 to 2 per high-power field. The dipstick panel run in parallel shows blood at 2+ and leukocyte esterase negative; the analyzer was not used for this case.
The erythrocyte count is reproducible across the representative fields examined, so the finding is that erythrocytes were observed above this worksheet's stated interval. That observation does not by itself establish where the blood originated or why. The blood pad's heme activity and the sediment erythrocyte count are distinct observations that agree in this case: the pad detects heme activity, while microscopy counts intact erythrocytes. The negative leukocyte esterase result and low leukocyte count also agree, but neither pair substitutes for the other or establishes cause.
Quantify what a systematic scan actually recovered, state the finding in the laboratory's own units and interval, and keep the sediment observation separate from any statement about cause.
Illustrative drawing — this picture was drawn rather than captured.
| Item | Result | Local worksheet reference or flag |
|---|---|---|
| Clarity | Slightly hazy | Descriptive only |
| Dipstick blood | 2+ | Local strip instructions decision limit |
| Dipstick leukocyte esterase | Negative | Local strip instructions decision limit |
| Erythrocytes, high power | 12 to 18 /HPF | Local adult interval 0 to 2 /HPF |
| Leukocytes, high power | 0 to 2 /HPF | Local adult interval 0 to 5 /HPF |
| Squamous epithelial cells | Rare | Local category only |
| Hyaline casts, low power | 0 to 1 /LPF | Local category only |
| Crystals | None seen | No reportable interval |
Knowledge checks
Reading and checks are open. Sign in only to save.
Knowledge check 1
Knowledge check 2
Section status
Finish this section
Reading and checks are open. Sign in only to save.
The module finishes after every required section is marked done and every check in those sections is correct.