When the analyzer flags a count or the results do not agree, review the blood film next. The film confirms or questions the instrument results. It identifies the cell populations behind flagged counts, detects counting interference, and provides the morphology needed to interpret the results.
Systematic microscopic film examination
Instrument flags, internal inconsistencies, and the clinical question together determine whether you review a film. Typical triggers include suspected platelet clumping, nucleated red cells, variant or blast cells, a failed rule-of-three check (hemoglobin × 3 should approximate the hematocrit), a count at odds with its film estimate, and specific questions such as suspected leukemia, unexplained anemia, or active infection. With a specimen in focus, align Köhler illumination by the microscope's procedure: focus and center the field diaphragm and open it just beyond the field of view, then set the condenser aperture for the objective and the contrast the examination needs. Adjust brightness with the illumination control or a neutral-density filter. The aperture diaphragm is not a brightness control.
Inspect the film macroscopically before microscopic review.
Scroll sideways to see all columns
| Naked-eye appearance of the film | Suggests |
|---|---|
| Diffusely blue tint | Elevated plasma protein; expect rouleaux, as in plasma cell myeloma |
| Grainy texture | Red-cell agglutination from a cold autoantibody |
| Visible holes | Lipemia; check for hemoglobin interference |
| Blue specks past the feather edge | Marked leukocytosis or thrombocytosis |
Low power (10× objective, 100× total). Survey quality and distribution. Marked concentration of white cells along the side margins or feather edge, the snowplow effect, can make the monolayer nonrepresentative. Remake the film when distribution fails the laboratory's acceptance criteria. Reject a specimen with visible fibrin strands and request recollection. Rouleaux, agglutination, and large abnormal cells stand out at this power. Locate the usable counting area here: the zone where red cells lie singly with minimal overlap.
Intermediate power (40× high-dry or 50× oil). Count white cells in 10 consecutive fields in the usable area, average them, and multiply by the laboratory's validated factor to estimate the count.
Suppose a film averages 7 white cells per 40× field and the laboratory's validated factor is 2,000: the estimate is 7 × 2,000 = 14,000/µL (14 × 103/µL).
Every microscope's magnification-to-field-diameter relationship differs. Each laboratory validates its own multiplication factor against roughly 30 in-control specimens and adopts the factor from its own measurements, because a factor from another microscope does not fit this one.1
High power (100× oil, 1,000× total). Count along a systematic battlement track in the representative monolayer, where red cells lie singly with preserved central pallor. Inspect the margins and feather edge separately for concentrated abnormal cells or platelet clumps. Deliberately oversampling those areas biases the differential. Follow the laboratory's procedure for the number of cells and additional review. A larger tally improves sampling precision. No universal rule sets a 100-, 200-, or 400-cell count from the total WBC count alone. CLSI H20 defines a reference method for evaluating instruments. Routine reporting follows the laboratory's validated method.1,2
Platelet estimate. In the same 100× fields, count platelets across 10 consecutive fields in the optimal zone and average, then multiply by the laboratory's validated field factor.
With an adopted factor of 20,000/µL per platelet per field, an average of 14 gives 14 × 20,000 = 280,000/µL (280 × 103/µL).
In marked anemia or erythrocytosis, the field factor no longer fits the platelet-to-red-cell ratio, so calculate the estimate from the red-cell count:
Estimated platelets = (platelets counted ÷ erythrocytes counted in the same fields) × RBC count. Use the actual erythrocyte tally as the denominator, even when it differs from 200.
For an illustrative tally of 80 platelets and 2,000 erythrocytes in the same fields, the ratio is equivalent to 8/200. With a red-cell count of 2.10 × 10⁶/µL: (8 × 2.10 × 106) ÷ 200 = 84,000/µL = 84 × 103/µL.
Either film estimate checks the instrument count and detects platelet clumping or count interference. Grade morphology by your laboratory's validated policy. Report Auer rods as present whenever you see them.
The printable RBC morphology guide pairs stained blood-film photographs with the shape descriptions used during morphology review.
Red-cell morphology on the stained film
Red-cell evaluation covers size, hemoglobinization, shape, inclusions, immaturity, and arrangement. Check that what you see agrees with the analyzer indices, and investigate a mismatch before you report either.
Size and chromia. Uniform microcytosis or macrocytosis mirrors a decreased or increased MCV, and cell-to-cell size variation, anisocytosis, is the microscopic counterpart of an elevated RDW. Normal cells show central pallor occupying about one third of the cell diameter. Hypochromic cells show enlarged pallor from restricted hemoglobin loading in iron deficiency and thalassemia. A spherocyte that appears "hyperchromic" lacks central pallor. Its volume is reduced and its hemoglobin content is unchanged, which modestly raises its MCHC.
Scroll sideways to see all columns
| Shape (poikilocyte) | Description | Chief associations |
|---|---|---|
| Spherocyte | Dense, no central pallor | Hereditary spherocytosis, immune hemolytic anemia |
| Schistocyte | Fragmented helmet and triangle forms | Microangiopathic or mechanical fragmentation; in adults and full-term neonates, a count above 1% raises suspicion for thrombotic microangiopathy when other severe red-cell shape abnormalities are absent and the validated counting method is used. Preterm neonates have a different reference limit (up to 5%)3 |
| Target cell (codocyte) | Central hemoglobin puddle from excess membrane relative to volume | Liver disease, Hb C disease, thalassemia, post-splenectomy |
| Teardrop cell (dacrocyte) | Single pointed projection | Primary myelofibrosis and other marrow-infiltrative processes; also megaloblastic anemia |
| Elliptocyte/ovalocyte | Elongated oval | Hereditary elliptocytosis, iron deficiency, myelodysplasia; oval macrocytes specifically suggest megaloblastic change |
| Acanthocyte | Irregular, unevenly spaced spicules, absent pallor | Severe liver disease (spur cell anemia), abetalipoproteinemia, post-splenectomy |
| Echinocyte (crenated cell) | Uniform, regularly spaced short spicules | Usually a drying or pH artifact; also uremia and pyruvate kinase deficiency; regular spacing distinguishes it from the acanthocyte |
| Rouleaux | Stacked-coin aggregation | Elevated plasma protein (myeloma, macroglobulinemia); disperses with saline; true cold-antibody agglutination persists |
| Sickle cell | Crescent with pointed ends | Hemoglobin S polymerization on deoxygenation |
Scroll sideways to see all columns
| Inclusion | Composition | Chief associations |
|---|---|---|
| Howell-Jolly body | Nuclear DNA remnant | Post-splenectomy, hyposplenism, megaloblastic anemia |
| Basophilic stippling | Aggregated ribosomal RNA | Thalassemia, sideroblastic states; coarse stippling classically suggests lead toxicity |
| Pappenheimer body | Clustered iron (siderotic) granules | Post-splenectomy, sideroblastic anemia, hemolysis; confirm with Prussian blue |
| Cabot ring | Mitotic-spindle remnant | Megaloblastic anemia, dyserythropoiesis |
| Heinz body | Precipitated, denatured hemoglobin | G6PD deficiency, unstable hemoglobins, oxidant exposure; invisible on Wright stain and requires a supravital stain |
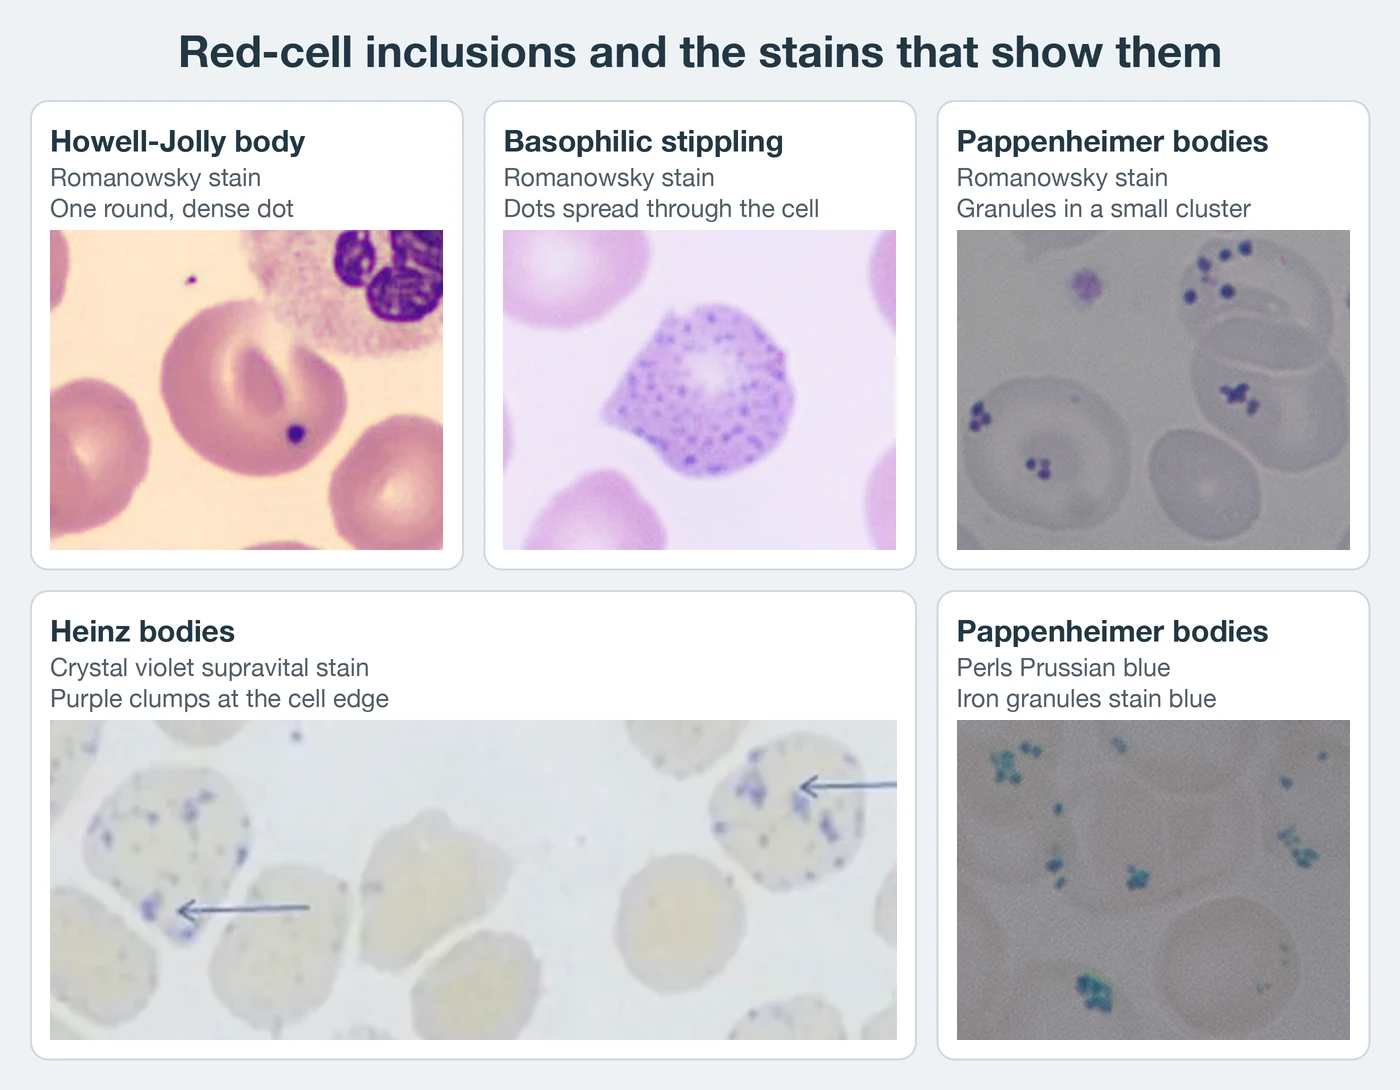
Polychromatophilic cells are larger and slate-blue-gray. They are young reticulocytes and indicate a marrow response. The film cannot quantify that response, so measure it with the reticulocyte count and its production index. Nucleated red cells released into the blood in severe anemia indicate marrow stress or infiltration. When the analyzer does not enumerate and subtract them automatically, apply the corrected-white-cell formula from the cell-count lesson.
White-cell parameters
Read the white-cell panel in order: total count, relative differential, absolute differential, morphology.
- Confirm the count against the histogram and scatterplot. Nucleated red-cell handling is platform specific.
- Assess the total: leukocytosis or leukopenia, then identify which cell line accounts for the change.
- Screen the relative differential against reference terminology.
Scroll sideways to see all columns
| Cell line | Increase | Decrease |
|---|---|---|
| Neutrophil | Neutrophilia | Neutropenia |
| Lymphocyte | Lymphocytosis | Lymphopenia |
| Monocyte | Monocytosis | Monocytopenia |
| Eosinophil | Eosinophilia | The reference interval begins at zero |
| Basophil | Basophilia | The reference interval begins at zero |
- Calculate absolute counts as percentage × total white count, because percentages depend on each other. A relative change in one cell line can result entirely from a real change in another.
Suppose the white count is 18.0 × 10³/µL with 76% neutrophils, 14% lymphocytes, 7% monocytes, 2% eosinophils, and 1% basophils. Absolute neutrophils = 0.76 × 18.0 = 13.7 × 10³/µL, clearly elevated. Absolute lymphocytes = 0.14 × 18.0 = 2.5 × 10³/µL, within the laboratory's absolute lymphocyte interval despite the low percentage. The absolute counts show that the lymphocyte number is normal and that neutrophilia is real. The absolute neutrophil count specifically grades neutropenia risk in chemotherapy and infection contexts.
- Note immature cells by name in any line, such as prolymphocyte, lymphoblast, promonocyte, or monoblast. Immature eosinophils and basophils are reported simply as immature.
- Report morphology such as toxic granulation, Döhle bodies, vacuolization, and hypersegmentation in a separate section from the count.
The current CLSI reference differential keeps segmented neutrophils and band forms as separate categories and recognizes that some instruments combine them. Whether a routine report displays bands separately or inside the neutrophil count follows the laboratory's validated method and reporting policy.2
Red-cell parameters and indices
The red-cell panel is the red-cell count, hemoglobin, hematocrit, MCV, MCH, MCHC, RDW, and morphology. Read it in a deliberate order.
Hemoglobin first, because it measures oxygen-carrying capacity directly and hematocrit depends on cell size. The rule of three provides the internal check: for normocytic, normochromic blood, 3 × hemoglobin (g/dL) approximates the hematocrit (%) within about 3.
Hematocrit (%) is approximately (hemoglobin × 3) ± 3
With hemoglobin 12.0 g/dL, the expected hematocrit is 36%, roughly 33 to 39%. A reported hematocrit of 35% fits. A reported 44% does not fit. Review it for legitimate index effects or a spurious measurement before release.1
MCV against the film and the classical classification.
Scroll sideways to see all columns
MCV Term Below 80 fL Microcytic 80–100 fL Normocytic Above 100 fL Macrocytic MCHC for chromia. Normal values run 32 to 36 g/dL. Below 32 g/dL is hypochromic. Mild elevation, 36 to 38 g/dL, accompanies spherocytosis. A marked elevation, occasionally approaching 60 g/dL, is spurious and is caused by lipemia, icterus, or marked leukocytosis interfering with the spectrophotometric hemoglobin measurement. The MCHC therefore also serves as a built-in analytic quality-control check.1
RDW, the red-cell histogram coefficient of variation (typical reference interval about 11.5 to 14.5%), quantifies anisocytosis. Only an elevated RDW is meaningful. MCV and RDW read together give more information than either one. A normal MCV with an elevated RDW suggests a mixed or early population.1
Morphology corroborates the indices. Do not add a free-text comment when film morphology is entirely normal. Comment only on an observed abnormality.
Red-cell count and MCH last. The red-cell count cannot be used to judge anemia severity, because in thalassemia the count is classically normal to high as hemoglobin falls. This discordance is diagnostically useful. MCH usually follows MCV, since smaller cells contain less hemoglobin. When it does not, the MCHC shows the mismatch.
Index formulas, each with its own example values:
MCV (fL) = (HCT % ÷ RBC ×106/µL) × 10 Hematocrit 36%, red cells 4.20 × 10⁶/µL: MCV = (36 ÷ 4.20) × 10 = 85.7 fL, normocytic.
MCH (pg) = (HGB g/dL × 10) ÷ RBC ×106/µL Hemoglobin 11.2 g/dL, red cells 4.20 × 10⁶/µL: MCH = (11.2 × 10) ÷ 4.20 = 26.7 pg, within the ASCP BOC examination interval of 26 to 34 pg. MCH is not used alone to classify anemia. The complete ASCP BOC examination reference resource also gives MCV as 76 to 100 fL. That examination interval differs from the classical 80 fL microcytosis boundary above. Use the range supplied for the task.
MCHC (g/dL) = (HGB g/dL × 100) ÷ HCT % Hemoglobin 11.2 g/dL, hematocrit 36%: MCHC = (11.2 × 100) ÷ 36 = 31.1 g/dL, just below the 32 g/dL limit, mildly hypochromic.
Reading the indices together. A patient has hemoglobin 9.8 g/dL, hematocrit 31%, red cells 3.50 × 10⁶/µL, MCV 88.6 fL, MCH 28.0 pg, MCHC 31.6 g/dL, and RDW-CV 16.1%. By the rule of three, the expected hematocrit is 29.4%, compatible with the reported 31%. The MCV is normocytic, the MCHC is borderline low, and the RDW is increased. This pattern suggests an early or mild iron-restricted process, before a clear microcytic or macrocytic pattern develops.
Quantitative hemoglobin: the cyanmethemoglobin method
CLSI H15-A3, though archived from active revision, remains a technically valid reference procedure for hemoglobin concentration by the cyanmethemoglobin (hemiglobincyanide) method.4 Blood is diluted into alkaline Drabkin reagent, which contains potassium ferricyanide, potassium cyanide, sodium bicarbonate, and a surfactant. Ferricyanide oxidizes hemoglobin iron from ferrous to ferric, converting every circulating hemoglobin species to methemoglobin. Cyanide then binds the methemoglobin to stable cyanmethemoglobin, whose absorbance at 540 nm is directly proportional to hemoglobin concentration. Sulfhemoglobin is the only species not converted, so it is not measured. Clinically significant sulfhemoglobinemia is rare.
Procedure in brief. Prepare a standard curve from a certified cyanmethemoglobin standard, and repeat it with each new reagent lot or after any spectrophotometer change. Dilute patient or control blood 1:251 into reagent. Allow 10 minutes for complete conversion. Read at 540 nm against a reagent blank and convert to concentration from the curve.
Sources of error. The reagent is light-sensitive, so store it in the dark or in an amber container. Lipemia, high leukocyte or platelet counts, incompletely lysed cells, and precipitated paraproteins can add turbidity and falsely increase absorbance. The amount that causes significant error and the correction depend on the reagent, dilution, photometer, and validated procedure. Possible method-specific corrections include a plasma blank, clearing particulates from the reacted dilution, further dilution, or a low-precipitation reagent. Do not apply a fixed cell-count threshold or a universal 1:2 correction from one method to another.1,4 The reagent contains cyanide. Never pour it down a drain. Dispose of it as licensed hazardous waste.
Some handheld point-of-care devices avoid the cyanide hazard by forming azidemethemoglobin and reading it at two wavelengths to cancel turbidity. Others, including the HemoCue Hb 301, measure whole-blood absorbance directly without a lysing reagent, so the device instructions define the measurement principle and its interferences.7 Some laboratory analyzers lyse with sodium lauryl sulfate to form SLS-methemoglobin, a nontoxic alternative chemistry.
Hemoglobin variant testing
Quantitative methods measure the hemoglobin concentration. Variant testing identifies which hemoglobins are present. Hb S solubility testing is a screen for detectable Hb S. Confirm every positive result by fractionation. Evaluation of other hemoglobinopathies and thalassemias begins with fractionation and, when needed, molecular testing.
Hemoglobin solubility (sickle) screen. Whole blood is lysed with saponin in a buffered solution containing sodium dithionite, a reducing agent that deoxygenates hemoglobin. Deoxygenated Hb S polymerizes and turns the solution turbid. Lines behind the tube become invisible. Solutions of non-sickling hemoglobins stay clear. The screen cannot distinguish sickle cell trait from sickle cell disease. False negatives occur in severe anemia, where there is too little hemoglobin to produce visible turbidity, and in very young infants, where Hb S is small relative to the large Hb F fraction. Recent transfusion may also reduce the detectable Hb S fraction.5
Confirmatory and quantitative methods compared:
Scroll sideways to see all columns
| Method | Separation principle | Strengths | Limitations |
|---|---|---|---|
| Alkaline hemoglobin electrophoresis (cellulose acetate or agarose) | Net negative charge, migration toward the anode | Simple, inexpensive; separates the common variants A, F, S, C | Hb D and G comigrate with S; Hb C comigrates with E and O; poor precision at low Hb A2 and F levels |
| Acid hemoglobin electrophoresis (citrate agar) | Charge at acid pH | Resolves the alkaline comigrating pairs, S from D/G and C from E/O | A confirmatory second step, never primary |
| Cation-exchange HPLC | Differential column retention time | Automated; accurately quantifies low-level Hb A2 and F; strong for thalassemia screening | Hb A2 and Hb E co-elute; Hb S may falsely elevate apparent A2; some variants missed |
| Capillary zone electrophoresis | Charge-based migration in a silica capillary at alkaline pH | Small sample volume, good resolution, high throughput | Availability varies by laboratory |
| Isoelectric focusing | Migration to the pH where net charge reaches zero | Resolves variants differing by as little as 0.02 pH unit; used in neonatal screening panels | Technically demanding, expensive |
| Molecular testing (Sanger, targeted PCR, next-generation sequencing) | Direct DNA analysis | Definitive for rare or complex mutations | Unnecessary for routine diagnosis when CBC, electrophoresis, and HPLC already agree |
A negative solubility screen with normal fractionation excludes detectable Hb S only when the patient's age, hemoglobin concentration, transfusion history, expected Hb S fraction, and assay sensitivity make the tests reliable. Infants, severe anemia, low Hb S fractions, and recent transfusion require definitive fractionation and, when needed, molecular testing. Always follow a positive solubility test with electrophoresis or HPLC to separate sickle cell trait (Hb AS) from sickle cell disease (Hb SS or a compound heterozygote such as Hb SC or Hb S-β-thalassemia).
β-thalassemia minor and iron deficiency anemia both show a microcytic, hypochromic pattern and must be distinguished:
Scroll sideways to see all columns
| Feature | β-thalassemia minor | Iron deficiency anemia |
|---|---|---|
| Red-cell count | Normal to mildly increased | Normal to decreased |
| MCV | Markedly decreased, disproportionate to the mild anemia | Decreased, proportionate to severity |
| RDW | Normal or increased, overlapping with iron deficiency | Normal or increased |
| Basophilic stippling | May be present | Absent |
| Target cells | May be present | May be present; the finding discriminates poorly |
| Hemoglobin A2 | Increased once iron deficiency is excluded | Normal or decreased |
| Ferritin | Normal, unless iron deficiency coexists | Decreased |
| Serum iron | Normal, unless iron deficiency coexists | Decreased |
| TIBC or transferrin | Normal | Increased |
| Transferrin saturation | Normal, unless iron deficiency coexists | Decreased |
Iron deficiency independently lowers hemoglobin A2, so interpret Hb A2 for β-thalassemia trait only after iron deficiency is excluded or corrected. No single index distinguishes the two conditions. Read the complete count, film, and iron studies together.
Microhematocrit
The hematocrit is the fraction of whole blood occupied by packed erythrocytes, the packed cell volume, reported as a percentage or a fraction, 36% or 0.36 L/L.
Measurement. Use the capillary tube, filling and sealing instructions, centrifugation force, maximum packing time, and duplicate-acceptance limit established for the instrument and laboratory procedure. Read the packed erythrocyte column relative to the total blood column, excluding the buffy coat. CLSI H07-A3 is an archived technical reference. Do not take a universal spin time or duplicate limit from it. Use the values validated for your system.6
Sources of error. A leaking seal falsely lowers the result, because erythrocytes are lost preferentially from the tube bottom. Excess anticoagulant from a short-drawn tube shrinks cells and lowers the reading. Under-centrifugation, a delayed reading, or inclusion of the buffy coat falsely raises it. After acute hemorrhage the hematocrit may initially remain unchanged and then fall as plasma volume is restored, and dehydration raises it through hemoconcentration. Sickle cell anemia, macrocytic and hypochromic anemias, spherocytosis, and thalassemia trap plasma within the packed column, so the spun measurement may be biased upward by trapped plasma. Centrifugation can also dehydrate cells, partly offsetting that effect. There is no universal percentage correction between a spun result and an automated result. Investigate a discrepancy with both methods' limitations in mind, and report neither result until the discrepancy is resolved.6
References
- Keohane EM, Preston MM, Mirza KM, Walenga JM, eds. Rodak's Hematology: Clinical Principles and Applications. 7th ed. Elsevier; 2025. Accessed August 31, 2026. Back to text
- Clinical and Laboratory Standards Institute. Reference Leukocyte Differential Count (Proportional) and Evaluation of Instrumental Methods. CLSI document H20-Ed3. Wayne, PA: CLSI; 2026. Back to text
- Zini G, d'Onofrio G, Erber WN, et al. 2021 update of the 2012 ICSH recommendations for identification, diagnostic value, and quantitation of schistocytes: impact and revisions. Int J Lab Hematol. 2021;43(6):1264-1271. doi:10.1111/ijlh.13682. Back to text
- Clinical and Laboratory Standards Institute. Reference and Selected Procedures for the Quantitative Determination of Hemoglobin in Blood; Approved Standard. CLSI document H15-A3. Wayne, PA: CLSI; 2000. Back to text
- Mayo Clinic Laboratories. Sickle solubility, blood (SDEX). Clinical Information, Cautions, and Method Description. Accessed September 7, 2026. Back to text
- Clinical and Laboratory Standards Institute. Procedure for Determining Packed Cell Volume by the Microhematocrit Method; Approved Standard. CLSI document H07-A3. Wayne, PA: CLSI; 2000. Back to text
- US Food and Drug Administration. 510(k) premarket notification K201217 decision summary: HemoCue Hb 301 System. Accessed September 13, 2026. Back to text
- Palmer L, Briggs C, McFadden S, et al. ICSH recommendations for the standardization of nomenclature and grading of peripheral blood cell morphological features. Int J Lab Hematol. 2015;37(3):287-303. doi:10.1111/ijlh.12327. Back to text
- Dewi M, Jusman SWA, Harahap AR, Baird JK. Quantifying phenylhydrazine-induced Heinz body formation in normal human erythrocytes by flow cytometry versus microscopy or spectrophotometry. Biol Methods Protoc. 2026;11(1):bpag047. doi:10.1093/biomethods/bpag047. Back to text